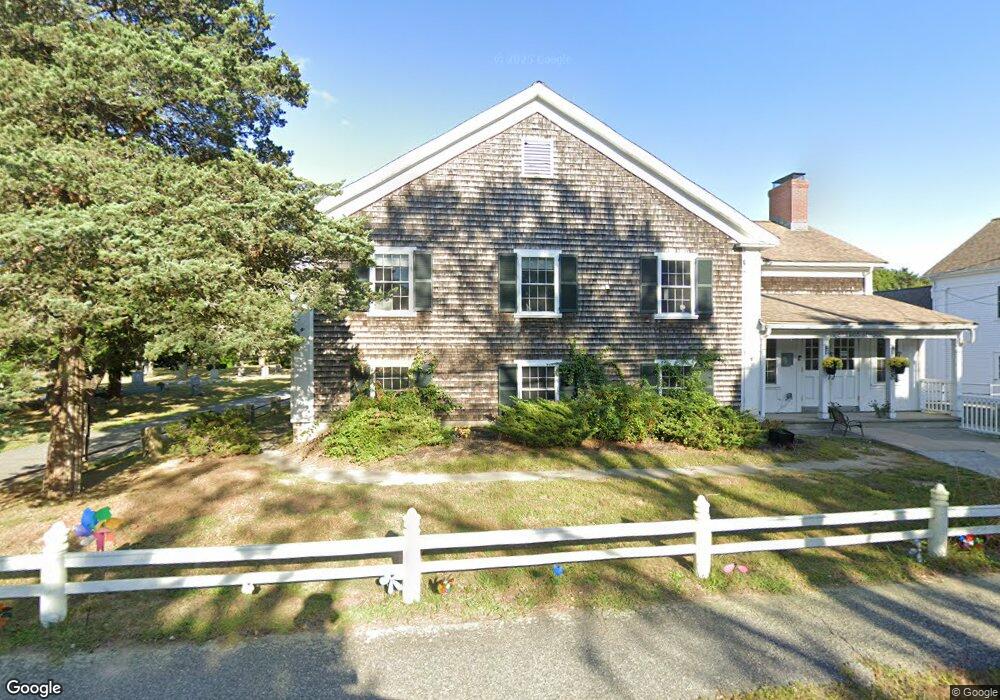
218 Main St West Dennis, MA 2670
West Dennis NeighborhoodEstimated Value: $552,000 - $2,548,217
3
Beds
2
Baths
1,686
Sq Ft
$776/Sq Ft
Est. Value
About This Home
This home is located at 218 Main St, West Dennis, MA 2670 and is currently estimated at $1,308,804, approximately $776 per square foot. 218 Main St is a home located in Barnstable County with nearby schools including Dennis-Yarmouth Regional High School and St. Pius X. School.
Ownership History
Date
Name
Owned For
Owner Type
Purchase Details
Closed on
May 11, 2016
Sold by
Peterson Ft
Bought by
Haidas Vivian and Haidas Van
Current Estimated Value
Home Financials for this Owner
Home Financials are based on the most recent Mortgage that was taken out on this home.
Original Mortgage
$960,000
Outstanding Balance
$747,375
Interest Rate
3%
Mortgage Type
Adjustable Rate Mortgage/ARM
Estimated Equity
$561,429
Purchase Details
Closed on
Jun 17, 2013
Sold by
Anness Lowell H and Anness Edna F
Bought by
Anness Rt
Create a Home Valuation Report for This Property
The Home Valuation Report is an in-depth analysis detailing your home's value as well as a comparison with similar homes in the area
Home Values in the Area
Average Home Value in this Area
Purchase History
| Date | Buyer | Sale Price | Title Company |
|---|---|---|---|
| Haidas Vivian | $1,200,000 | -- | |
| Anness Rt | -- | -- |
Source: Public Records
Mortgage History
| Date | Status | Borrower | Loan Amount |
|---|---|---|---|
| Open | Haidas Vivian | $960,000 |
Source: Public Records
Tax History Compared to Growth
Tax History
| Year | Tax Paid | Tax Assessment Tax Assessment Total Assessment is a certain percentage of the fair market value that is determined by local assessors to be the total taxable value of land and additions on the property. | Land | Improvement |
|---|---|---|---|---|
| 2025 | $1,833 | $423,300 | $175,300 | $248,000 |
| 2024 | $1,778 | $405,000 | $168,500 | $236,500 |
| 2023 | $1,722 | $368,700 | $153,200 | $215,500 |
| 2022 | $1,685 | $300,900 | $138,000 | $162,900 |
| 2021 | $1,701 | $282,100 | $135,300 | $146,800 |
| 2020 | $1,879 | $308,100 | $135,300 | $172,800 |
| 2019 | $1,931 | $312,900 | $132,700 | $180,200 |
| 2018 | $1,655 | $261,000 | $103,300 | $157,700 |
| 2017 | $1,603 | $260,600 | $103,300 | $157,300 |
| 2016 | $1,702 | $260,700 | $126,300 | $134,400 |
| 2015 | $1,668 | $260,700 | $126,300 | $134,400 |
| 2014 | $1,683 | $265,100 | $126,300 | $138,800 |
Source: Public Records
Map
Nearby Homes
- 209 Main St Unit 5
- 209 Main St Unit 6
- 209 Main St Unit 4
- 209 Main St Unit 3
- 209 Main St Unit 2
- 209 Main St Unit 1
- 141 Main St Unit 4
- 141 Main St Unit 23
- 23 Doric Ave
- 14 Schoolhouse Ln
- 401 Main St Unit 201
- 401 Main St Unit 101
- 178 School St
- 45 Seth Ln
- 29 Bass River Rd
- 18 Turner Ln
- 308 Old Main St
- 24 Regan Rd
- 22 Beach View Rd
- 116 N Main St
- 230 Main St
- 226 Main St
- 202 Main St
- 202 Main St
- 196 Massachusetts 28 Unit A
- 196 Main St
- 223 Main St
- 111 Main St Confidential
- 221 Massachusetts 28
- 40 Cove Rd
- 191 Main Route 28 Hwy
- 22 Cove Rd
- 207 Main St
- 34 Cove Rd
- 195 Main St
- 199 Main St
- 231 Main St Confidential
- 231 Main St
- 231 Main St
- 184 Main Street (Route 28)