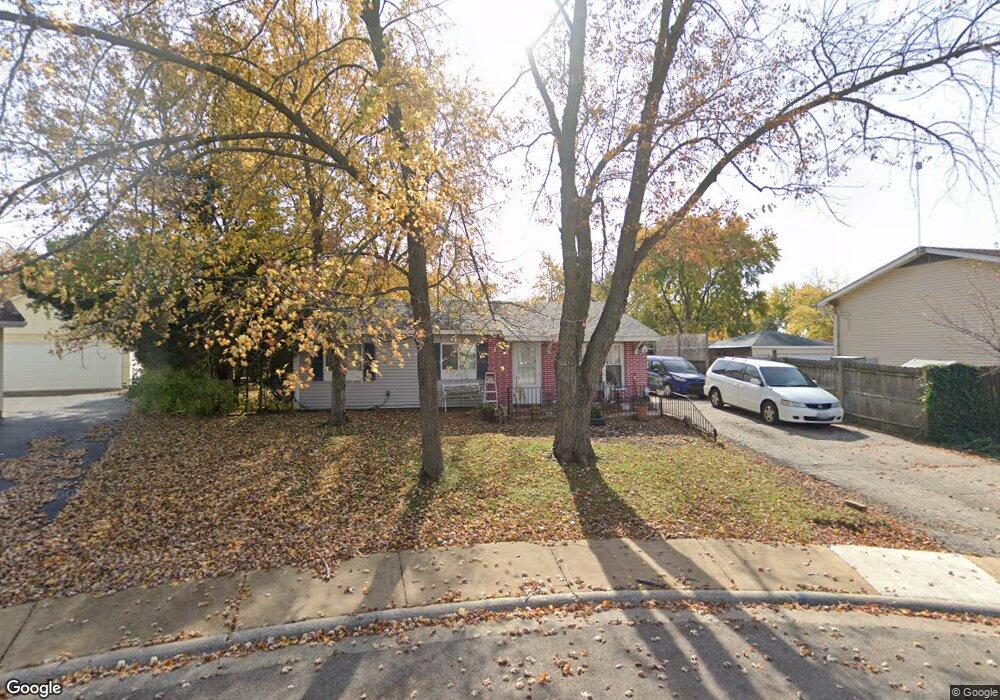
218 Malibu Ct Bolingbrook, IL 60440
East Bolingbrook NeighborhoodEstimated Value: $262,000 - $282,482
3
Beds
1
Bath
1,128
Sq Ft
$243/Sq Ft
Est. Value
About This Home
This home is located at 218 Malibu Ct, Bolingbrook, IL 60440 and is currently estimated at $273,871, approximately $242 per square foot. 218 Malibu Ct is a home located in Will County with nearby schools including Jonas E Salk Elementary School, Brooks Middle School, and Hubert H Humphrey Middle School.
Ownership History
Date
Name
Owned For
Owner Type
Purchase Details
Closed on
Aug 1, 2017
Sold by
Close Kenneth
Bought by
Tuition Renovations Llc
Current Estimated Value
Purchase Details
Closed on
Sep 30, 2008
Sold by
Deutsche Bank Trust Company
Bought by
Close Kenneth
Purchase Details
Closed on
Mar 27, 2008
Sold by
Ruiz Javier Quintana and Case #07 Ch 1123
Bought by
Deutsche Bank Trust Co and Ixix 2006-He2
Purchase Details
Closed on
Dec 14, 2007
Sold by
Ruiz Javier Quintana
Bought by
Deutsche Bank Trust Co Americas and Ixis 2006-He2
Purchase Details
Closed on
Aug 17, 2006
Sold by
Walker Diane
Bought by
Quintana Ruiz Javier
Home Financials for this Owner
Home Financials are based on the most recent Mortgage that was taken out on this home.
Original Mortgage
$150,800
Interest Rate
9.79%
Mortgage Type
Purchase Money Mortgage
Create a Home Valuation Report for This Property
The Home Valuation Report is an in-depth analysis detailing your home's value as well as a comparison with similar homes in the area
Home Values in the Area
Average Home Value in this Area
Purchase History
| Date | Buyer | Sale Price | Title Company |
|---|---|---|---|
| Tuition Renovations Llc | -- | Attorney | |
| Close Kenneth | $89,500 | Premier Title | |
| Deutsche Bank Trust Co | -- | None Available | |
| Deutsche Bank Trust Co Americas | $169,420 | None Available | |
| Quintana Ruiz Javier | $188,500 | Attorneys Title Guaranty Fun |
Source: Public Records
Mortgage History
| Date | Status | Borrower | Loan Amount |
|---|---|---|---|
| Previous Owner | Quintana Ruiz Javier | $150,800 |
Source: Public Records
Tax History Compared to Growth
Tax History
| Year | Tax Paid | Tax Assessment Tax Assessment Total Assessment is a certain percentage of the fair market value that is determined by local assessors to be the total taxable value of land and additions on the property. | Land | Improvement |
|---|---|---|---|---|
| 2024 | $6,931 | $75,052 | $17,238 | $57,814 |
| 2023 | $6,931 | $67,529 | $15,510 | $52,019 |
| 2022 | $5,843 | $59,108 | $13,576 | $45,532 |
| 2021 | $5,564 | $55,267 | $12,694 | $42,573 |
| 2020 | $5,447 | $53,450 | $12,277 | $41,173 |
| 2019 | $5,252 | $50,904 | $11,692 | $39,212 |
| 2018 | $4,961 | $47,767 | $10,972 | $36,795 |
| 2017 | $4,745 | $45,277 | $10,400 | $34,877 |
| 2016 | $4,628 | $43,100 | $9,900 | $33,200 |
| 2015 | $4,406 | $41,300 | $9,500 | $31,800 |
| 2014 | $4,406 | $39,700 | $9,100 | $30,600 |
| 2013 | $4,406 | $36,100 | $8,300 | $27,800 |
Source: Public Records
Map
Nearby Homes
- 219 Monterey Dr
- 233 Malibu Dr Unit 4
- 168 Bedford Rd
- 308 Pacific Dr
- 316 Bedford Rd
- 220 Falcon Ridge Way
- 325 Rockhurst Rd
- 117 Enclave Cir Unit A
- 109 Arrowhead Ln
- 101 Enclave Cir Unit C
- 220 Braemar Glen
- 124 Wedgewood Way
- 220 N Ashbury Ave
- 112 Brook Ct
- 222 Aspen Ct
- 255 Braemar Glen
- 492 Ridge Ln
- 490 Ridge Ln
- 488 Ridge Ln
- 458 Ridge Ln
- 220 Malibu Ct
- 213 Monterey Ct
- 211 Monterey Ct
- 212 Malibu Dr
- 214 Malibu Ct
- 222 Malibu Ct
- 210 Malibu Dr
- 215 Monterey Ct
- 217 Monterey Dr
- 209 Monterey Ct
- 226 Malibu Ct
- 221 Monterey Dr Unit 4
- 228 Malibu Ct
- 208 Malibu Dr
- 224 Malibu Ct
- 223 Monterey Dr
- 230 Malibu Ct
- 207 Monterey Ct
- 225 Monterey Dr
- 206 Malibu Dr