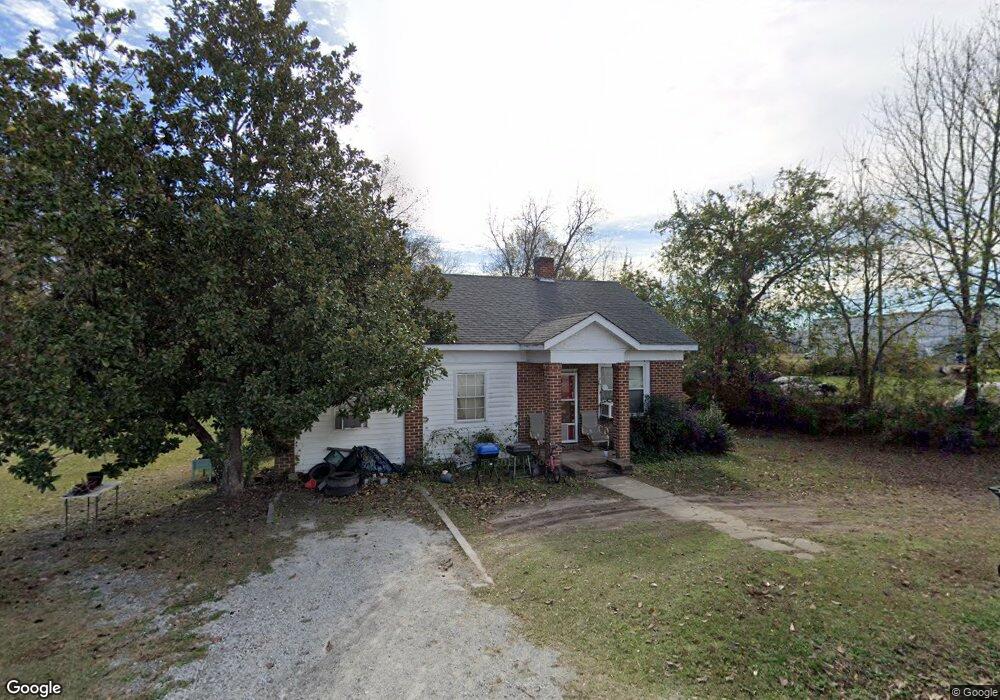
218 Mcdonough St Elberton, GA 30635
Estimated Value: $149,000 - $197,000
3
Beds
2
Baths
1,312
Sq Ft
$132/Sq Ft
Est. Value
About This Home
This home is located at 218 Mcdonough St, Elberton, GA 30635 and is currently estimated at $172,865, approximately $131 per square foot. 218 Mcdonough St is a home located in Elbert County with nearby schools including Elbert County Elementary School, Elbert County Primary School, and Elbert County Middle School.
Ownership History
Date
Name
Owned For
Owner Type
Purchase Details
Closed on
Nov 18, 2005
Sold by
Imagine Investments I Llc
Bought by
Chandran Samuel
Current Estimated Value
Home Financials for this Owner
Home Financials are based on the most recent Mortgage that was taken out on this home.
Original Mortgage
$25,500
Interest Rate
6.04%
Purchase Details
Closed on
Nov 17, 2005
Sold by
First Citizens Bank & Tr
Bought by
Imagine Investments I Llc
Home Financials for this Owner
Home Financials are based on the most recent Mortgage that was taken out on this home.
Original Mortgage
$25,500
Interest Rate
6.04%
Purchase Details
Closed on
Jan 4, 2005
Sold by
Mcminn Keith A
Bought by
First Bank Citizens Bank & T
Purchase Details
Closed on
Apr 28, 2000
Sold by
Hite Michael D and Hite Ka
Bought by
Mcminn Keith A
Purchase Details
Closed on
Aug 1, 1998
Purchase Details
Closed on
Apr 1, 1989
Purchase Details
Closed on
Dec 1, 1964
Purchase Details
Closed on
Jan 1, 1925
Create a Home Valuation Report for This Property
The Home Valuation Report is an in-depth analysis detailing your home's value as well as a comparison with similar homes in the area
Home Values in the Area
Average Home Value in this Area
Purchase History
| Date | Buyer | Sale Price | Title Company |
|---|---|---|---|
| Chandran Samuel | $27,500 | -- | |
| Imagine Investments I Llc | $20,000 | -- | |
| First Bank Citizens Bank & T | -- | -- | |
| Mcminn Keith A | $43,100 | -- | |
| -- | $32,500 | -- | |
| -- | -- | -- | |
| -- | -- | -- | |
| -- | $2,000 | -- |
Source: Public Records
Mortgage History
| Date | Status | Borrower | Loan Amount |
|---|---|---|---|
| Closed | Chandran Samuel | $25,500 |
Source: Public Records
Tax History Compared to Growth
Tax History
| Year | Tax Paid | Tax Assessment Tax Assessment Total Assessment is a certain percentage of the fair market value that is determined by local assessors to be the total taxable value of land and additions on the property. | Land | Improvement |
|---|---|---|---|---|
| 2024 | $947 | $40,508 | $4,713 | $35,795 |
| 2023 | $997 | $40,508 | $4,713 | $35,795 |
| 2022 | $594 | $24,139 | $4,713 | $19,426 |
| 2021 | $598 | $24,139 | $4,713 | $19,426 |
| 2020 | $603 | $21,859 | $5,237 | $16,622 |
| 2019 | $622 | $21,859 | $5,237 | $16,622 |
| 2018 | $725 | $24,907 | $5,237 | $19,670 |
| 2017 | $676 | $21,530 | $5,237 | $16,293 |
| 2016 | $632 | $21,530 | $5,237 | $16,293 |
| 2015 | -- | $21,530 | $5,237 | $16,293 |
| 2014 | -- | $21,530 | $5,237 | $16,293 |
| 2013 | -- | $21,530 | $5,237 | $16,293 |
Source: Public Records
Map
Nearby Homes
- 243 W Tate St
- 89 College Ave
- 345 N Oliver St
- 346 N Oliver St
- 968 Ext Elbert St
- 136 Forest Ave
- 0 Pulliam St Unit 7659662
- 0 Pulliam St Unit 10616872
- 44 Clairmont Ave
- 62 Oak St
- 1020 Hickory Dr
- 381 College Ave
- 108 Brookhaven Cir
- 170 Lake Forest Dr
- 118 Oak Dr
- 105 S Thomas St
- 0 Sara Jane Dr Unit 10501253
- 2790 Cedar Creek Rd
- 0 Oak Dr Unit 7643600
- 0 Oak Dr Unit 10598083
- 224 Mcdonough St
- 228 Mcdonough St
- 221 Long Ave
- 211 W Tate St
- 124 W Railroad St
- 219 W Tate St
- 216 Highland Park
- 91 W Tate St Unit A
- 214 Highland Park
- 218 Long Ave
- 231 W Tate St
- 218 Highland Park
- 112 Long Ave
- 206 W Tate St
- 83 W Tate St
- 234 Long Ave
- 208 W Tate St
- 210 W Tate St
- 92 W Tate St
- 96 W Tate St