218 Mink San Antonio, TX 78213
Dellview NeighborhoodEstimated Value: $134,000 - $190,000
2
Beds
1
Bath
1,026
Sq Ft
$155/Sq Ft
Est. Value
About This Home
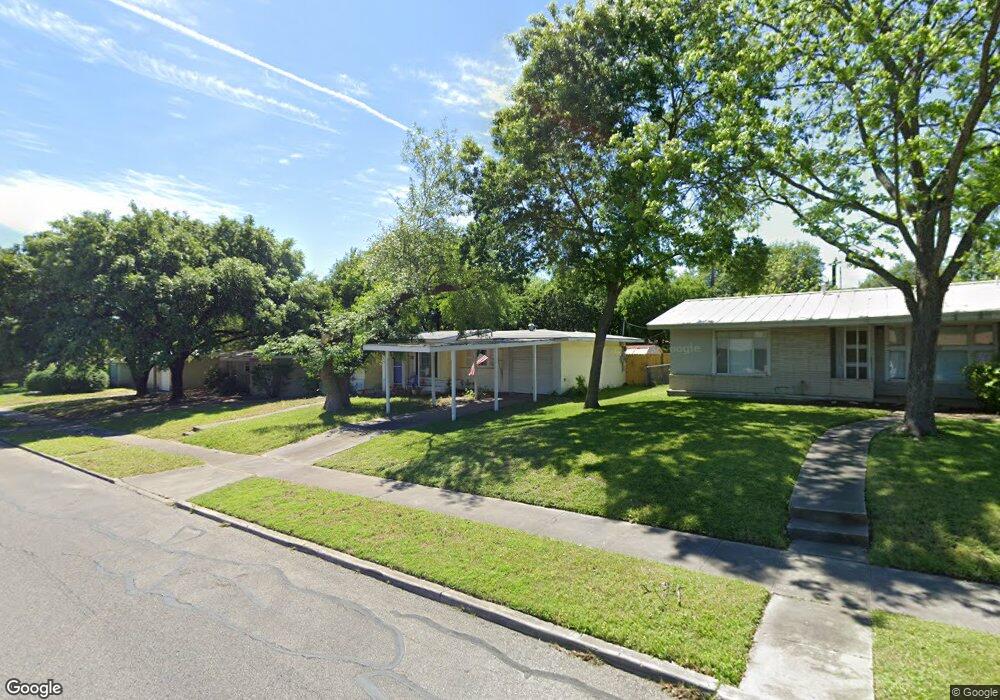
This home is located at 218 Mink, San Antonio, TX 78213 and is currently estimated at $159,367, approximately $155 per square foot. 218 Mink is a home located in Bexar County with nearby schools including Arnold Elementary School, Thomas Jefferson High School, and John Greenleaf Whittier Middle School.
Ownership History
Date
Name
Owned For
Owner Type
Purchase Details
Closed on
Aug 29, 2002
Sold by
Flores Jose
Bought by
Pierce Barbara A
Current Estimated Value
Home Financials for this Owner
Home Financials are based on the most recent Mortgage that was taken out on this home.
Original Mortgage
$74,160
Outstanding Balance
$31,499
Interest Rate
6.47%
Estimated Equity
$127,868
Purchase Details
Closed on
Aug 1, 2001
Sold by
Deuvall Donna L and Deuvall William R
Bought by
Flores Jose
Home Financials for this Owner
Home Financials are based on the most recent Mortgage that was taken out on this home.
Original Mortgage
$61,514
Interest Rate
7.07%
Create a Home Valuation Report for This Property
The Home Valuation Report is an in-depth analysis detailing your home's value as well as a comparison with similar homes in the area
Home Values in the Area
Average Home Value in this Area
Purchase History
| Date | Buyer | Sale Price | Title Company |
|---|---|---|---|
| Pierce Barbara A | -- | -- | |
| Flores Jose | -- | -- |
Source: Public Records
Mortgage History
| Date | Status | Borrower | Loan Amount |
|---|---|---|---|
| Open | Pierce Barbara A | $74,160 | |
| Previous Owner | Flores Jose | $61,514 |
Source: Public Records
Tax History Compared to Growth
Tax History
| Year | Tax Paid | Tax Assessment Tax Assessment Total Assessment is a certain percentage of the fair market value that is determined by local assessors to be the total taxable value of land and additions on the property. | Land | Improvement |
|---|---|---|---|---|
| 2025 | $2,413 | $180,411 | $55,130 | $129,740 |
| 2024 | $2,413 | $164,010 | $55,130 | $108,880 |
| 2023 | $2,413 | $151,535 | $55,130 | $101,760 |
| 2022 | $3,733 | $137,759 | $50,200 | $95,580 |
| 2021 | $3,499 | $125,235 | $35,690 | $90,200 |
| 2020 | $3,227 | $113,850 | $35,690 | $85,150 |
| 2019 | $2,966 | $103,500 | $26,190 | $77,310 |
| 2018 | $2,762 | $97,340 | $17,630 | $79,710 |
| 2017 | $2,517 | $89,166 | $17,630 | $78,640 |
| 2016 | $2,288 | $81,060 | $17,630 | $63,430 |
| 2015 | $1,605 | $73,744 | $16,890 | $62,890 |
| 2014 | $1,605 | $67,040 | $0 | $0 |
Source: Public Records
Map
Nearby Homes