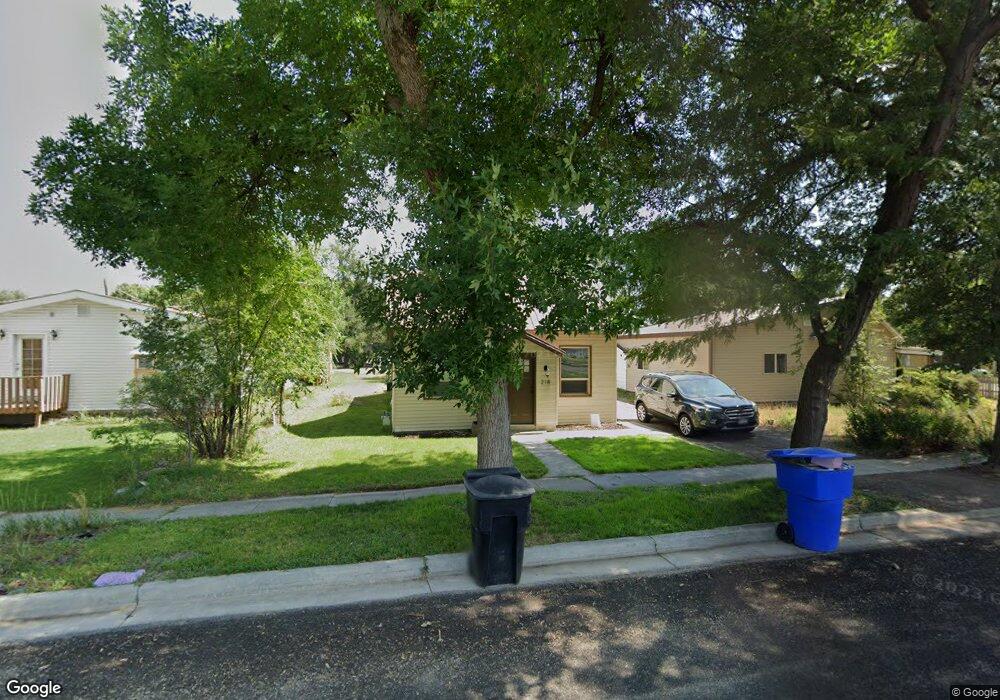
218 N 200 W Tremonton, UT 84337
Estimated Value: $261,000 - $275,000
2
Beds
1
Bath
892
Sq Ft
$300/Sq Ft
Est. Value
About This Home
This home is located at 218 N 200 W, Tremonton, UT 84337 and is currently estimated at $268,027, approximately $300 per square foot. 218 N 200 W is a home located in Box Elder County with nearby schools including North Park School, Alice C. Harris Intermediate School, and Bear River Middle School.
Ownership History
Date
Name
Owned For
Owner Type
Purchase Details
Closed on
May 27, 2021
Sold by
Catamount Properties 2018 Llc
Bought by
Means Ethan
Current Estimated Value
Home Financials for this Owner
Home Financials are based on the most recent Mortgage that was taken out on this home.
Original Mortgage
$12,960
Outstanding Balance
$11,750
Interest Rate
2.99%
Mortgage Type
New Conventional
Estimated Equity
$256,277
Purchase Details
Closed on
Jan 28, 2021
Sold by
Sessions Connie G and Sessions Devon
Bought by
Catamount Properties 2018 Llc
Purchase Details
Closed on
May 13, 2008
Sold by
Sessions Devon and Sessions Connie Rae
Bought by
Sessions Devon and Sessions Connie G
Create a Home Valuation Report for This Property
The Home Valuation Report is an in-depth analysis detailing your home's value as well as a comparison with similar homes in the area
Home Values in the Area
Average Home Value in this Area
Purchase History
| Date | Buyer | Sale Price | Title Company |
|---|---|---|---|
| Means Ethan | -- | Northern Title Company | |
| Catamount Properties 2018 Llc | -- | American Secure Ttl Tremonto | |
| Sessions Devon | -- | -- |
Source: Public Records
Mortgage History
| Date | Status | Borrower | Loan Amount |
|---|---|---|---|
| Open | Means Ethan | $12,960 | |
| Open | Means Ethan | $216,015 |
Source: Public Records
Tax History Compared to Growth
Tax History
| Year | Tax Paid | Tax Assessment Tax Assessment Total Assessment is a certain percentage of the fair market value that is determined by local assessors to be the total taxable value of land and additions on the property. | Land | Improvement |
|---|---|---|---|---|
| 2025 | $1,346 | $230,231 | $105,000 | $125,231 |
| 2024 | $1,346 | $228,343 | $105,000 | $123,343 |
| 2023 | $1,270 | $211,512 | $100,000 | $111,512 |
| 2022 | $968 | $91,944 | $16,500 | $75,444 |
| 2021 | $1,408 | $99,895 | $30,000 | $69,895 |
| 2020 | $661 | $99,895 | $30,000 | $69,895 |
| 2019 | $626 | $50,520 | $16,500 | $34,020 |
| 2018 | $473 | $35,465 | $13,750 | $21,715 |
| 2017 | $496 | $64,481 | $13,750 | $39,481 |
| 2016 | $493 | $34,431 | $13,750 | $20,681 |
| 2015 | $463 | $32,551 | $13,750 | $18,801 |
| 2014 | $463 | $31,655 | $13,750 | $17,905 |
| 2013 | -- | $31,656 | $13,338 | $18,318 |
Source: Public Records
Map
Nearby Homes