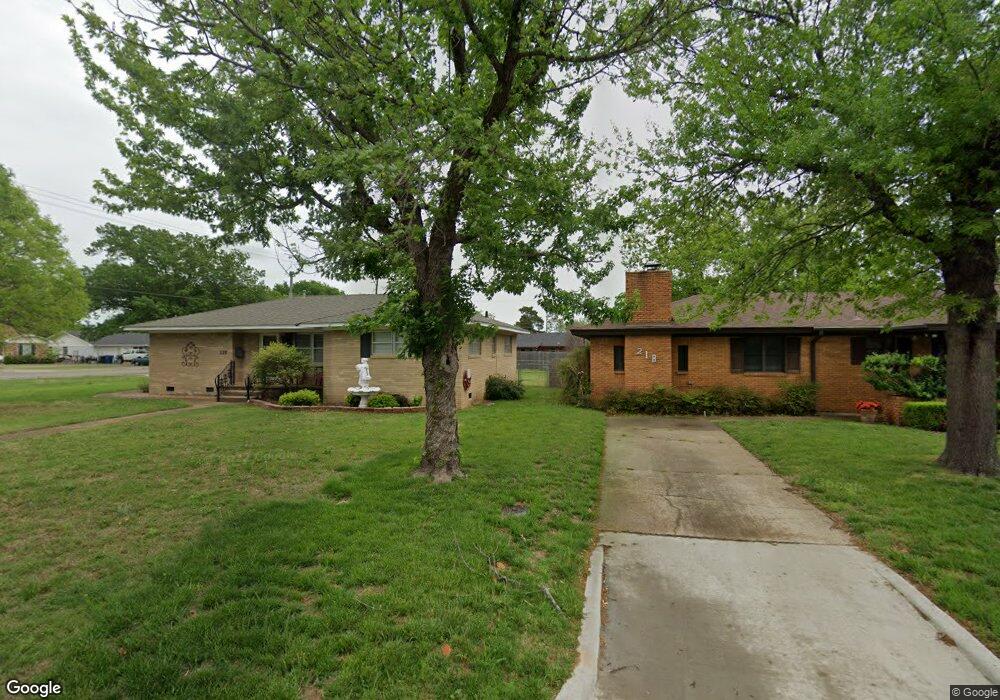
218 N 29th St Duncan, OK 73533
Estimated Value: $157,000 - $189,000
3
Beds
2
Baths
1,851
Sq Ft
$93/Sq Ft
Est. Value
About This Home
This home is located at 218 N 29th St, Duncan, OK 73533 and is currently estimated at $172,238, approximately $93 per square foot. 218 N 29th St is a home located in Stephens County with nearby schools including Mark Twain Elementary School, Duncan Middle School, and Duncan High School.
Ownership History
Date
Name
Owned For
Owner Type
Purchase Details
Closed on
May 26, 2023
Sold by
Patricia Dee Hammond Trust
Bought by
Cullum Alexander Preston
Current Estimated Value
Home Financials for this Owner
Home Financials are based on the most recent Mortgage that was taken out on this home.
Original Mortgage
$131,100
Outstanding Balance
$127,374
Interest Rate
6.27%
Mortgage Type
New Conventional
Estimated Equity
$44,864
Purchase Details
Closed on
Sep 14, 2017
Sold by
Hammond Patricia Dee
Bought by
Hammond Patricia Dee and The Patricia Dee Hammond Trust
Create a Home Valuation Report for This Property
The Home Valuation Report is an in-depth analysis detailing your home's value as well as a comparison with similar homes in the area
Home Values in the Area
Average Home Value in this Area
Purchase History
| Date | Buyer | Sale Price | Title Company |
|---|---|---|---|
| Cullum Alexander Preston | $138,000 | Old Republic Title | |
| Hammond Patricia Dee | -- | None Available |
Source: Public Records
Mortgage History
| Date | Status | Borrower | Loan Amount |
|---|---|---|---|
| Open | Cullum Alexander Preston | $131,100 |
Source: Public Records
Tax History Compared to Growth
Tax History
| Year | Tax Paid | Tax Assessment Tax Assessment Total Assessment is a certain percentage of the fair market value that is determined by local assessors to be the total taxable value of land and additions on the property. | Land | Improvement |
|---|---|---|---|---|
| 2025 | $1,249 | $16,137 | $996 | $15,141 |
| 2024 | $1,249 | $15,667 | $996 | $14,671 |
| 2023 | $1,249 | $12,837 | $955 | $11,882 |
| 2022 | $990 | $12,226 | $938 | $11,288 |
| 2021 | $887 | $11,422 | $908 | $10,514 |
| 2020 | $843 | $10,767 | $840 | $9,927 |
| 2019 | $818 | $10,453 | $822 | $9,631 |
| 2018 | $815 | $10,453 | $822 | $9,631 |
| 2017 | $761 | $10,149 | $794 | $9,355 |
| 2016 | $728 | $9,566 | $769 | $8,797 |
| 2015 | $657 | $9,288 | $758 | $8,530 |
| 2014 | $657 | $9,017 | $747 | $8,270 |
Source: Public Records
Map
Nearby Homes
- 0 W Beech Ave
- 206 N 28th St
- 210 210 N 31st St
- 1244 Carriage Dr
- 106 Emery Rd
- 507 N Alice Dr
- 201 N 23rd St
- 209 N 22nd St
- 2210 Western Dr
- 210 N 22nd St
- 2108 Ave
- 1359 Smith Rd
- 1385 Smith Rd
- 2011 2011 W Oak Ave
- 2110 W Main St
- 2006 W Oak Ave
- 2230 W Spruce St
- 2206 2206 W Spruce
- 2204 W Parkview Ave
- 174831 N 2844 Rd