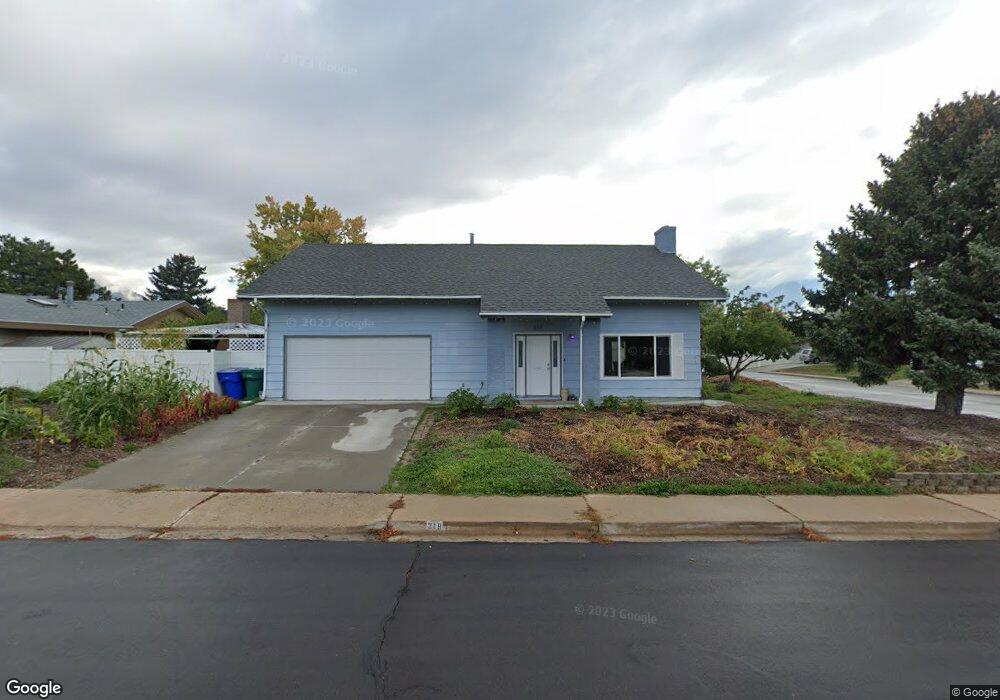
218 N 300 W Orem, UT 84057
Suncrest NeighborhoodEstimated Value: $480,000 - $501,000
4
Beds
3
Baths
1,800
Sq Ft
$272/Sq Ft
Est. Value
About This Home
This home is located at 218 N 300 W, Orem, UT 84057 and is currently estimated at $489,071, approximately $271 per square foot. 218 N 300 W is a home located in Utah County with nearby schools including Orem Junior High School, Mountain View High School, and Noah Webster Academy.
Ownership History
Date
Name
Owned For
Owner Type
Purchase Details
Closed on
Jan 4, 2021
Sold by
Farley Gary R and Farley Deanna L
Bought by
Jensen Ellis
Current Estimated Value
Purchase Details
Closed on
Oct 1, 2018
Sold by
Farley Deanna L
Bought by
Farley Gary R and Farley Deanna L
Home Financials for this Owner
Home Financials are based on the most recent Mortgage that was taken out on this home.
Original Mortgage
$207,000
Interest Rate
4.5%
Mortgage Type
New Conventional
Purchase Details
Closed on
Dec 8, 2016
Sold by
Delange Christopher Clark and Delange Deanna
Bought by
Delange Deanna
Purchase Details
Closed on
Oct 25, 2010
Sold by
Delange Christopher C
Bought by
Delange Christopher C and Delange Deanna
Home Financials for this Owner
Home Financials are based on the most recent Mortgage that was taken out on this home.
Original Mortgage
$213,644
Interest Rate
4.5%
Mortgage Type
FHA
Purchase Details
Closed on
Nov 20, 2009
Sold by
Delange Christopher C
Bought by
Delange Christopher C and Delange Deanna
Home Financials for this Owner
Home Financials are based on the most recent Mortgage that was taken out on this home.
Original Mortgage
$212,135
Interest Rate
4.88%
Mortgage Type
FHA
Purchase Details
Closed on
Nov 6, 2007
Sold by
Delange Christopher C and Delange Deanna
Bought by
Delange Christopher C
Home Financials for this Owner
Home Financials are based on the most recent Mortgage that was taken out on this home.
Original Mortgage
$212,135
Interest Rate
6.4%
Mortgage Type
New Conventional
Purchase Details
Closed on
Nov 5, 2007
Sold by
Delange Christopher C
Bought by
Delange Christopher C and Delange Deanna
Home Financials for this Owner
Home Financials are based on the most recent Mortgage that was taken out on this home.
Original Mortgage
$212,135
Interest Rate
6.4%
Mortgage Type
New Conventional
Purchase Details
Closed on
Nov 17, 2005
Sold by
Calderon Victor
Bought by
Delange Christopher C
Purchase Details
Closed on
Nov 16, 2005
Sold by
Delange Christopher C
Bought by
Delange Christopher C and Delange Deanna
Purchase Details
Closed on
Sep 4, 2003
Sold by
Calderon Victor and Leon Evangelina
Bought by
Calderon Victor
Purchase Details
Closed on
Nov 24, 1998
Sold by
Green Charles Dale and Green Jeanine Elise
Bought by
Calderon Victor and Leon Evangelina
Home Financials for this Owner
Home Financials are based on the most recent Mortgage that was taken out on this home.
Original Mortgage
$121,909
Interest Rate
6.84%
Create a Home Valuation Report for This Property
The Home Valuation Report is an in-depth analysis detailing your home's value as well as a comparison with similar homes in the area
Home Values in the Area
Average Home Value in this Area
Purchase History
| Date | Buyer | Sale Price | Title Company |
|---|---|---|---|
| Jensen Ellis | -- | Inwest Title Orem | |
| Farley Gary R | -- | Cottonwood Title Ins Agency | |
| Delange Deanna | -- | None Available | |
| Delange Christopher C | -- | Eagle Pointe Title Insuranc | |
| Delange Christopher C | -- | Eagle Pointe Title Insuranc | |
| Delange Christopher C | -- | Eagle Pointe Title Insuranc | |
| Delange Christopher C | -- | Eagle Pointe Title Insuranc | |
| Delange Christopher C | -- | Eagle Pointe Title Insuranc | |
| Delange Christopher C | -- | Eagle Pointe Title Insuranc | |
| Delange Christopher C | -- | Backman Title Services Ltd | |
| Delange Christopher C | -- | Equity Title | |
| Calderon Victor | -- | -- | |
| Calderon Victor | -- | Republic Title |
Source: Public Records
Mortgage History
| Date | Status | Borrower | Loan Amount |
|---|---|---|---|
| Previous Owner | Farley Gary R | $207,000 | |
| Previous Owner | Delange Christopher C | $213,644 | |
| Previous Owner | Delange Christopher C | $212,135 | |
| Previous Owner | Delange Christopher C | $212,135 | |
| Previous Owner | Calderon Victor | $121,909 | |
| Closed | Calderon Victor | $5,000 |
Source: Public Records
Tax History
| Year | Tax Paid | Tax Assessment Tax Assessment Total Assessment is a certain percentage of the fair market value that is determined by local assessors to be the total taxable value of land and additions on the property. | Land | Improvement |
|---|---|---|---|---|
| 2025 | $1,834 | $236,060 | -- | -- |
| 2024 | $1,834 | $224,235 | $0 | $0 |
| 2023 | $1,708 | $224,455 | $0 | $0 |
| 2022 | $1,749 | $222,640 | $0 | $0 |
| 2021 | $1,604 | $309,400 | $114,000 | $195,400 |
| 2020 | $1,482 | $280,900 | $91,200 | $189,700 |
| 2019 | $1,361 | $268,300 | $91,200 | $177,100 |
| 2018 | $529 | $241,700 | $87,700 | $154,000 |
| 2017 | $417 | $118,690 | $0 | $0 |
| 2016 | $278 | $101,805 | $0 | $0 |
| 2015 | $260 | $98,505 | $0 | $0 |
| 2014 | $241 | $95,590 | $0 | $0 |
Source: Public Records
Map
Nearby Homes
- 277 W Garden Park Dr
- 223 N 360 W
- 196 N 400 W
- 241 W Garden Park
- 285 N 300 W
- 243 W 310 North St
- 241 W 310 St N
- 208 W Garden Park
- 162 N 450 W Unit 2
- 62 N 380 W
- 62 N Garden Park Dr Unit 8
- 508 W 40 N
- 64 S 320 W
- 302 W 100 S
- 565 W 40 N
- 369 N Main St Unit 2
- 33 W 400 N
- 597 N State St Unit 25
- 180 S 70 W
- 156 N 130 E
Your Personal Tour Guide
Ask me questions while you tour the home.