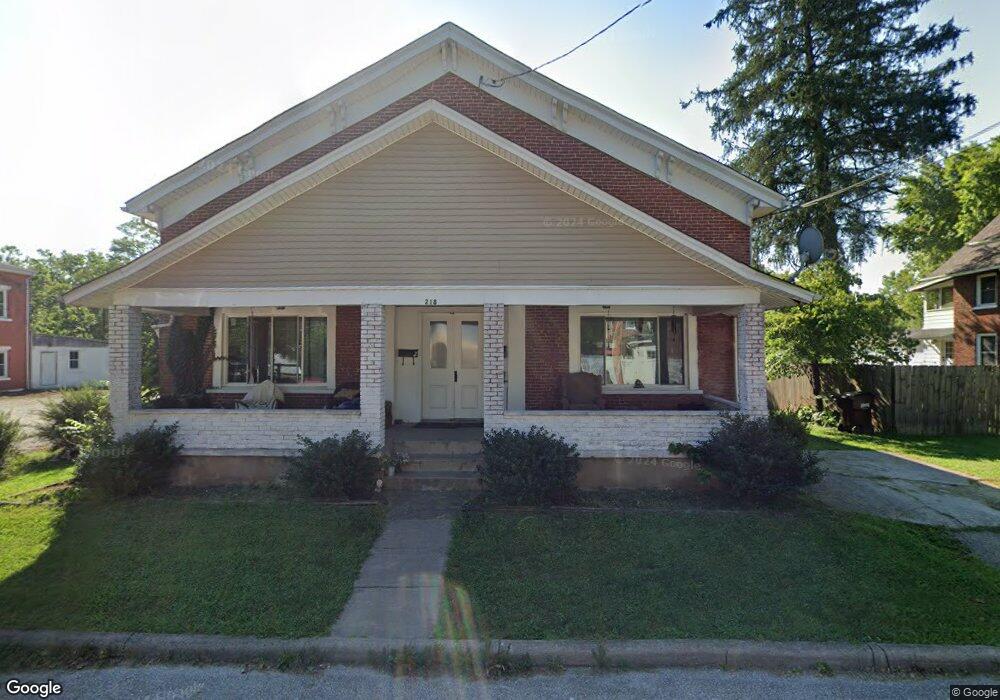
218 N Front St Williamsburg, OH 45176
Estimated Value: $242,000 - $272,000
4
Beds
2
Baths
2,400
Sq Ft
$109/Sq Ft
Est. Value
About This Home
This home is located at 218 N Front St, Williamsburg, OH 45176 and is currently estimated at $261,212, approximately $108 per square foot. 218 N Front St is a home located in Clermont County with nearby schools including Williamsburg Elementary School and Williamsburg High School.
Ownership History
Date
Name
Owned For
Owner Type
Purchase Details
Closed on
Oct 5, 2021
Sold by
Wright Jordan
Bought by
Hbj Properties Llc
Current Estimated Value
Home Financials for this Owner
Home Financials are based on the most recent Mortgage that was taken out on this home.
Original Mortgage
$117,600
Outstanding Balance
$105,598
Interest Rate
2.8%
Mortgage Type
Commercial
Estimated Equity
$155,614
Purchase Details
Closed on
Mar 9, 2020
Sold by
Wright Kellie
Bought by
Wright Jordan
Home Financials for this Owner
Home Financials are based on the most recent Mortgage that was taken out on this home.
Original Mortgage
$101,250
Interest Rate
3.5%
Mortgage Type
New Conventional
Purchase Details
Closed on
Oct 10, 2006
Sold by
Bellingham Sarah K
Bought by
Wright Kellie
Home Financials for this Owner
Home Financials are based on the most recent Mortgage that was taken out on this home.
Original Mortgage
$92,000
Interest Rate
6.87%
Mortgage Type
Unknown
Create a Home Valuation Report for This Property
The Home Valuation Report is an in-depth analysis detailing your home's value as well as a comparison with similar homes in the area
Home Values in the Area
Average Home Value in this Area
Purchase History
We collect this data history from publicly available records. To have your information removed, we recommend requesting removal directly through your county’s website.
| Date | Buyer | Sale Price | Title Company |
|---|---|---|---|
| Hbj Properties Llc | -- | None Available | |
| Wright Jordan | $135,000 | Ivy Pointe Title Llc | |
| Wright Kellie | $115,000 | Attorney |
Source: Public Records
Mortgage History
We collect this data history from publicly available records. To have your information removed, we recommend requesting removal directly through your county’s website.
| Date | Status | Borrower | Loan Amount |
|---|---|---|---|
| Open | Hbj Properties Llc | $117,600 | |
| Previous Owner | Wright Jordan | $101,250 | |
| Previous Owner | Wright Kellie | $92,000 |
Source: Public Records
Tax History
| Year | Tax Paid | Tax Assessment Tax Assessment Total Assessment is a certain percentage of the fair market value that is determined by local assessors to be the total taxable value of land and additions on the property. | Land | Improvement |
|---|---|---|---|---|
| 2025 | $2,594 | $59,160 | $4,660 | $54,500 |
| 2024 | $2,604 | $59,160 | $4,660 | $54,500 |
| 2023 | $2,609 | $59,160 | $4,660 | $54,500 |
| 2022 | $2,383 | $48,370 | $3,780 | $44,590 |
| 2021 | $2,094 | $48,370 | $3,780 | $44,590 |
| 2020 | $2,150 | $48,370 | $3,780 | $44,590 |
| 2019 | $2,093 | $46,940 | $3,500 | $43,440 |
| 2018 | $2,098 | $46,940 | $3,500 | $43,440 |
| 2017 | $1,793 | $46,940 | $3,500 | $43,440 |
| 2016 | $1,793 | $37,560 | $2,800 | $34,760 |
| 2015 | $1,728 | $37,560 | $2,800 | $34,760 |
| 2014 | $1,728 | $37,560 | $2,800 | $34,760 |
| 2013 | $1,583 | $33,820 | $3,960 | $29,860 |
Source: Public Records
Map
Nearby Homes
- 134 N Front St
- 208 Walnut St
- 171 N 4th St
- 192 N Broadway St
- 172 Hudson Ave
- 114 Winding Trails Dr
- 114 Cornerstone Dr
- 111 Cornerstone Dr
- Acres Dela Palma Rd
- 120 Cornerstone Dr
- 109 Zachary Dr
- 4137 Township Hageman Crossing Rd
- 125 Kelly Dr
- 116 Kelly Dr
- 133 Kelly Dr
- 117 Kelly Dr
- 159 Zachary Dr
- 4252 State Route 276
- 3877 Todds Run Foster Rd
- 4021 Barrick Low Ln
Your Personal Tour Guide
Ask me questions while you tour the home.