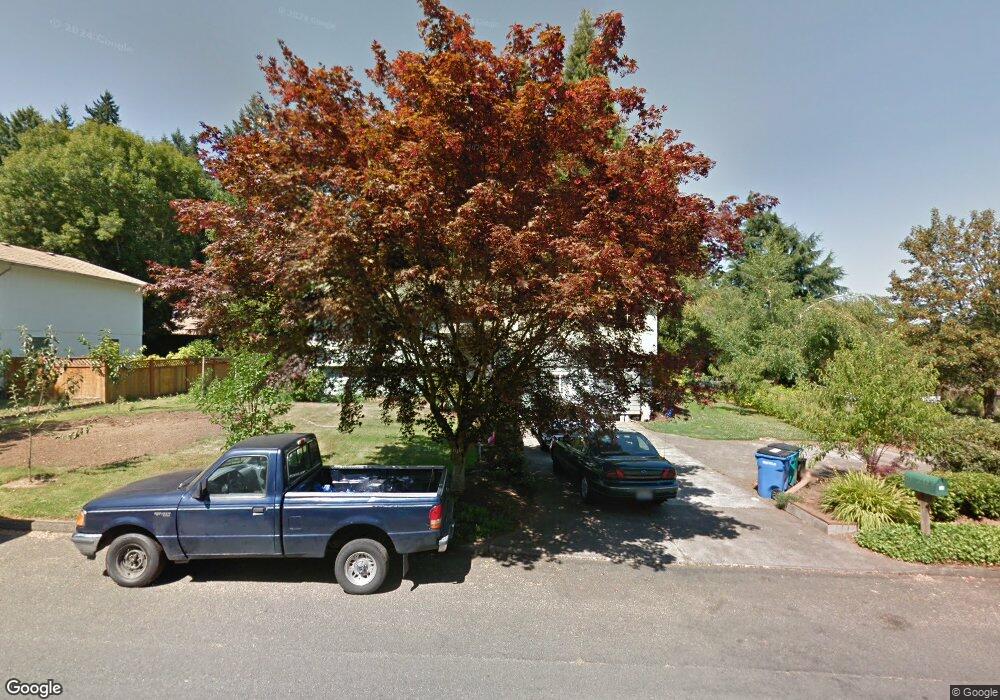
218 NW 82nd St Vancouver, WA 98665
West Hazel Dell NeighborhoodEstimated Value: $495,000 - $594,000
5
Beds
3
Baths
2,369
Sq Ft
$230/Sq Ft
Est. Value
About This Home
This home is located at 218 NW 82nd St, Vancouver, WA 98665 and is currently estimated at $544,382, approximately $229 per square foot. 218 NW 82nd St is a home located in Clark County with nearby schools including Dwight D. Eisenhower Elementary School, Jason Lee Middle School, and Columbia River High School.
Ownership History
Date
Name
Owned For
Owner Type
Purchase Details
Closed on
Sep 14, 2015
Sold by
Oleksiewicz Joseph and Oleksiewicz Chalice
Bought by
Oleksiewicz 2010 Joseph M and Ol Chalice D
Current Estimated Value
Purchase Details
Closed on
Aug 25, 2014
Sold by
Giske Debra L
Bought by
Oleksiewicz Chalice and Oleksiewicz Joseph
Home Financials for this Owner
Home Financials are based on the most recent Mortgage that was taken out on this home.
Original Mortgage
$88,000
Outstanding Balance
$28,995
Interest Rate
4.12%
Mortgage Type
New Conventional
Estimated Equity
$515,387
Purchase Details
Closed on
Dec 5, 2008
Sold by
Giske Debra L
Bought by
Giske Debra L
Purchase Details
Closed on
Nov 4, 2005
Sold by
Ham Debra L and Ham Leslie A
Bought by
Lewis Julia
Purchase Details
Closed on
Jul 2, 1997
Sold by
Yanak Debra L
Bought by
Ham Debra L and Ham Leslie A
Create a Home Valuation Report for This Property
The Home Valuation Report is an in-depth analysis detailing your home's value as well as a comparison with similar homes in the area
Home Values in the Area
Average Home Value in this Area
Purchase History
| Date | Buyer | Sale Price | Title Company |
|---|---|---|---|
| Oleksiewicz 2010 Joseph M | -- | None Available | |
| Oleksiewicz Chalice | $237,719 | Columbia Title Agency | |
| Giske Debra L | -- | None Available | |
| Lewis Julia | $274,500 | Stewart Title | |
| Ham Debra L | -- | -- |
Source: Public Records
Mortgage History
| Date | Status | Borrower | Loan Amount |
|---|---|---|---|
| Open | Oleksiewicz Chalice | $88,000 |
Source: Public Records
Tax History Compared to Growth
Tax History
| Year | Tax Paid | Tax Assessment Tax Assessment Total Assessment is a certain percentage of the fair market value that is determined by local assessors to be the total taxable value of land and additions on the property. | Land | Improvement |
|---|---|---|---|---|
| 2025 | $4,998 | $511,772 | $209,000 | $302,772 |
| 2024 | $4,440 | $472,827 | $209,000 | $263,827 |
| 2023 | $4,416 | $454,004 | $209,000 | $245,004 |
| 2022 | $4,180 | $447,941 | $204,600 | $243,341 |
| 2021 | $3,925 | $377,591 | $140,250 | $237,341 |
| 2020 | $3,580 | $332,581 | $126,750 | $205,831 |
| 2019 | $3,273 | $322,147 | $126,750 | $195,397 |
| 2018 | $3,577 | $305,526 | $0 | $0 |
| 2017 | $3,173 | $278,798 | $0 | $0 |
| 2016 | $3,011 | $257,043 | $0 | $0 |
| 2015 | $3,020 | $227,899 | $0 | $0 |
| 2014 | -- | $220,752 | $0 | $0 |
| 2013 | -- | $189,311 | $0 | $0 |
Source: Public Records
Map
Nearby Homes
- 506 NW 82nd St
- 502 NW 77th St
- 606 NW 78th St
- 500 NE 83rd St
- 324 NW 87th St
- 136 NE 76th St
- 306 NE 85th St Unit 1A
- 511 NE 84th Cir
- 721 NW 76th St
- 7800 NW 10th Ct
- 1016 NW 81st Cir
- 8115 NE Highway 99
- 404 NE 71st St
- 7006 NE 2nd Ave
- 627 NE 72nd St
- 1215 NW 76th Cir
- 8208 NE 13th Ave Unit A5
- 8210 NE 13th Ave
- 8208 NE 13th Ave
- 8208 NE 13th Ave Unit A6
- 217 NW 82nd St
- 300 NW 82nd St
- 8208 NW Old Orchard Dr
- 206 NW 82nd St
- 301 NW 82nd St
- 300 NW Old Orchard Dr
- 8209 NW Old Orchard Dr
- 8107 NW Old Orchard Dr
- 308 NW 82nd St
- 8100 NW Old Orchard Dr
- 307 NW 82nd St
- 201 NW 82nd St
- 304 NW Old Orchard Dr
- 316 NW 82nd St
- 216 NW Old Orchard Dr
- 8206 NW Greenbriar Dr
- 8019 NW Old Orchard Dr
- 205 NW 83rd St
- 313 NW 82nd St
- 200 NW 82nd St