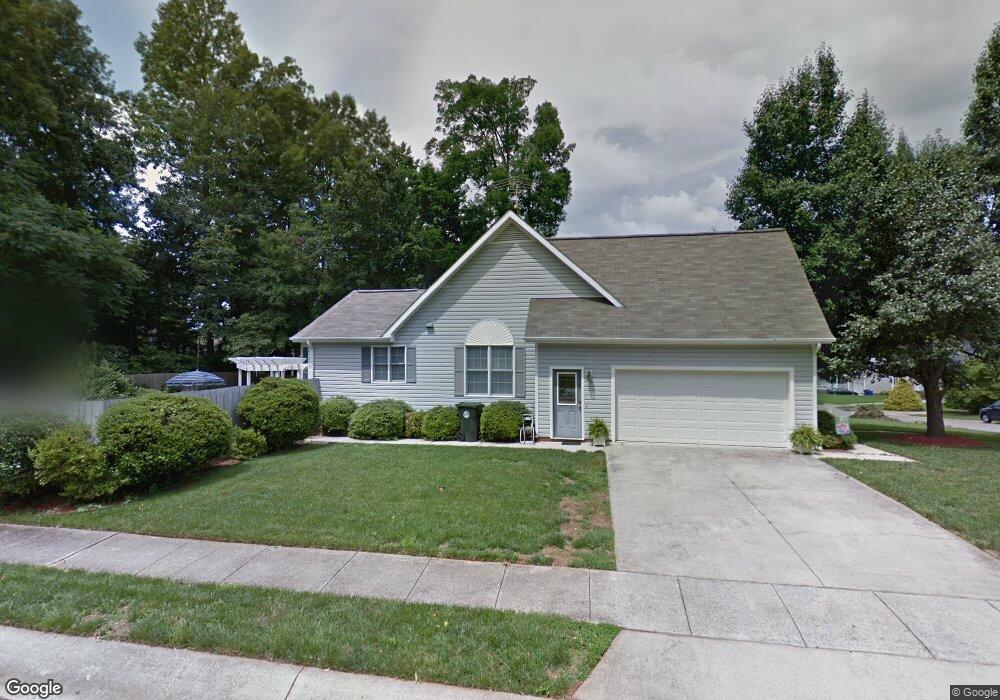
218 Paddle Ln Mebane, NC 27302
Estimated Value: $346,000 - $402,000
3
Beds
2
Baths
1,740
Sq Ft
$215/Sq Ft
Est. Value
About This Home
This home is located at 218 Paddle Ln, Mebane, NC 27302 and is currently estimated at $374,465, approximately $215 per square foot. 218 Paddle Ln is a home located in Alamance County with nearby schools including E.M. Yoder Elementary School, Woodlawn Middle School, and Eastern Alamance High School.
Ownership History
Date
Name
Owned For
Owner Type
Purchase Details
Closed on
Sep 27, 2006
Sold by
Leftwich Harold W
Bought by
Buchanan Shannon
Current Estimated Value
Home Financials for this Owner
Home Financials are based on the most recent Mortgage that was taken out on this home.
Original Mortgage
$202,000
Outstanding Balance
$120,671
Interest Rate
6.48%
Mortgage Type
New Conventional
Estimated Equity
$253,794
Purchase Details
Closed on
Aug 21, 2002
Sold by
Carter Gary L
Bought by
Tripp Milton W
Home Financials for this Owner
Home Financials are based on the most recent Mortgage that was taken out on this home.
Original Mortgage
$110,000
Interest Rate
6.53%
Purchase Details
Closed on
May 31, 2000
Sold by
Jordan Robert A
Bought by
Carter Gary L
Home Financials for this Owner
Home Financials are based on the most recent Mortgage that was taken out on this home.
Original Mortgage
$550,000
Interest Rate
8.14%
Create a Home Valuation Report for This Property
The Home Valuation Report is an in-depth analysis detailing your home's value as well as a comparison with similar homes in the area
Home Values in the Area
Average Home Value in this Area
Purchase History
| Date | Buyer | Sale Price | Title Company |
|---|---|---|---|
| Buchanan Shannon | $202,000 | -- | |
| Tripp Milton W | $191,500 | -- | |
| Carter Gary L | $490,000 | -- |
Source: Public Records
Mortgage History
| Date | Status | Borrower | Loan Amount |
|---|---|---|---|
| Open | Buchanan Shannon | $202,000 | |
| Previous Owner | Tripp Milton W | $110,000 | |
| Previous Owner | Carter Gary L | $550,000 |
Source: Public Records
Tax History Compared to Growth
Tax History
| Year | Tax Paid | Tax Assessment Tax Assessment Total Assessment is a certain percentage of the fair market value that is determined by local assessors to be the total taxable value of land and additions on the property. | Land | Improvement |
|---|---|---|---|---|
| 2025 | $3,082 | $356,736 | $55,000 | $301,736 |
| 2024 | $2,993 | $356,736 | $55,000 | $301,736 |
| 2023 | $2,847 | $356,736 | $55,000 | $301,736 |
| 2022 | $2,112 | $189,558 | $35,000 | $154,558 |
| 2021 | $2,131 | $189,558 | $35,000 | $154,558 |
| 2020 | $2,150 | $189,558 | $35,000 | $154,558 |
| 2019 | $2,161 | $189,558 | $35,000 | $154,558 |
| 2018 | $0 | $189,558 | $35,000 | $154,558 |
| 2017 | $1,990 | $189,558 | $35,000 | $154,558 |
| 2016 | $1,865 | $174,303 | $30,000 | $144,303 |
| 2015 | $1,006 | $174,303 | $30,000 | $144,303 |
| 2014 | $919 | $174,303 | $30,000 | $144,303 |
Source: Public Records
Map
Nearby Homes
- 901 N Fifth St
- 205 Esteban Ct
- 409 Reinsman Ct
- 705 E Ashland Dr
- 407 N Ninth St
- 609 Village Lake Dr
- 603 Village Lake Dr
- 638 Village Lake Dr
- 1012 Lake Michael Way
- 906 Beeline Ln
- 112 N Sixth St
- L279-280 N 10th St
- L277-278 N 10th St
- L37-41 N 10th St
- 701 N Carr St
- 1133 Tembrook Dr
- 1137 Tembrook Dr
- 1218 Hammond Dr
- 1222 Hammond Dr
- 1226 Hammond Dr