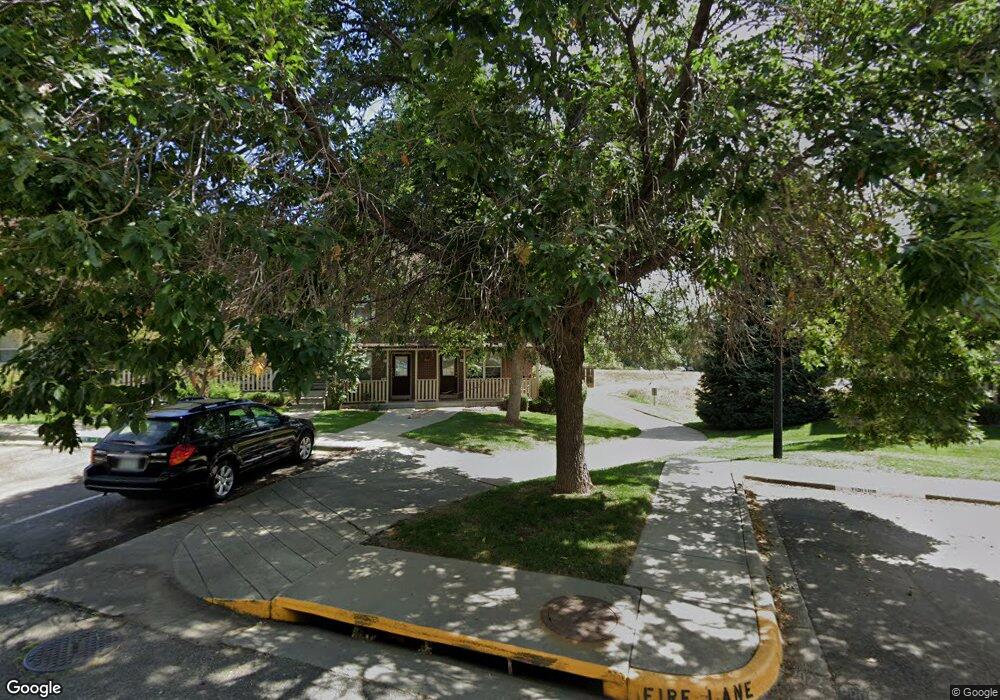
218 Pheasant Run Louisville, CO 80027
Estimated Value: $411,000 - $439,000
2
Beds
3
Baths
1,056
Sq Ft
$402/Sq Ft
Est. Value
About This Home
This home is located at 218 Pheasant Run, Louisville, CO 80027 and is currently estimated at $424,531, approximately $402 per square foot. 218 Pheasant Run is a home located in Boulder County with nearby schools including Coal Creek Elementary School, Louisville Middle School, and Monarch High School.
Ownership History
Date
Name
Owned For
Owner Type
Purchase Details
Closed on
Feb 9, 2007
Sold by
Curtis Lesly K
Bought by
Cooley Christopher C
Current Estimated Value
Home Financials for this Owner
Home Financials are based on the most recent Mortgage that was taken out on this home.
Original Mortgage
$126,000
Outstanding Balance
$75,343
Interest Rate
6.13%
Mortgage Type
Purchase Money Mortgage
Estimated Equity
$349,188
Purchase Details
Closed on
Mar 28, 1995
Sold by
Mountain Shadows Builders Inc
Bought by
Curtis Lesly K
Home Financials for this Owner
Home Financials are based on the most recent Mortgage that was taken out on this home.
Original Mortgage
$97,750
Interest Rate
8.72%
Purchase Details
Closed on
May 14, 1993
Bought by
Cooley Christopher C
Purchase Details
Closed on
Jun 6, 1991
Bought by
Cooley Christopher C
Purchase Details
Closed on
Jun 14, 1988
Bought by
Cooley Christopher C
Create a Home Valuation Report for This Property
The Home Valuation Report is an in-depth analysis detailing your home's value as well as a comparison with similar homes in the area
Home Values in the Area
Average Home Value in this Area
Purchase History
| Date | Buyer | Sale Price | Title Company |
|---|---|---|---|
| Cooley Christopher C | $172,000 | Land Title | |
| Curtis Lesly K | $102,925 | Commonwealth Land Title | |
| Cooley Christopher C | -- | -- | |
| Cooley Christopher C | $86,000 | -- | |
| Cooley Christopher C | -- | -- |
Source: Public Records
Mortgage History
| Date | Status | Borrower | Loan Amount |
|---|---|---|---|
| Open | Cooley Christopher C | $126,000 | |
| Previous Owner | Curtis Lesly K | $97,750 |
Source: Public Records
Tax History Compared to Growth
Tax History
| Year | Tax Paid | Tax Assessment Tax Assessment Total Assessment is a certain percentage of the fair market value that is determined by local assessors to be the total taxable value of land and additions on the property. | Land | Improvement |
|---|---|---|---|---|
| 2025 | $2,362 | $29,413 | $8,144 | $21,269 |
| 2024 | $2,362 | $29,413 | $8,144 | $21,269 |
| 2023 | $2,322 | $26,277 | $9,749 | $20,214 |
| 2022 | $2,483 | $25,805 | $7,728 | $18,077 |
| 2021 | $2,459 | $26,548 | $7,951 | $18,597 |
| 2020 | $2,311 | $24,697 | $6,507 | $18,190 |
| 2019 | $2,278 | $24,697 | $6,507 | $18,190 |
| 2018 | $1,926 | $21,557 | $3,384 | $18,173 |
| 2017 | $1,888 | $23,832 | $3,741 | $20,091 |
| 2016 | $1,589 | $18,061 | $4,139 | $13,922 |
| 2015 | $1,506 | $16,032 | $6,448 | $9,584 |
| 2014 | $1,371 | $16,032 | $6,448 | $9,584 |
Source: Public Records
Map
Nearby Homes
- 152 Pheasant Run
- 142 Pheasant Run
- 1615 Cottonwood Dr Unit 9
- 338 Pheasant Run
- 1612 Cottonwood Dr Unit 11W
- 253 W Cedar Way
- 1608 Cottonwood Dr Unit 11
- 357 W Harper St
- 322 W Harper St
- 419 Centennial Dr
- 1420 N Franklin Ct
- 1919 Quail Ct
- 1610 Longs Peak Dr
- 215 Sunland St
- 1655 Main St
- 1117 Lincoln Ave
- 1851 Gallagher Ln
- 1234 Jefferson Ave
- 501 W Linden St
- 310 W Spruce St
- 216 Pheasant Run
- 214 Pheasant Run
- 210 Pheasant Run
- 220 Pheasant Run
- 208 Pheasant Run
- 222 Pheasant Run
- 222 Pheasant Run Unit n/a
- 206 Pheasant Run
- 228 Pheasant Run
- 204 Pheasant Run
- 1753 Regal Ct
- 230 Pheasant Run
- 200 Pheasant Run
- 232 Pheasant Run
- 234 Pheasant Run
- 1781 Regal Ct
- 236 Pheasant Run
- 199 Pheasant Run
- 238 Pheasant Run
- 197 Pheasant Run