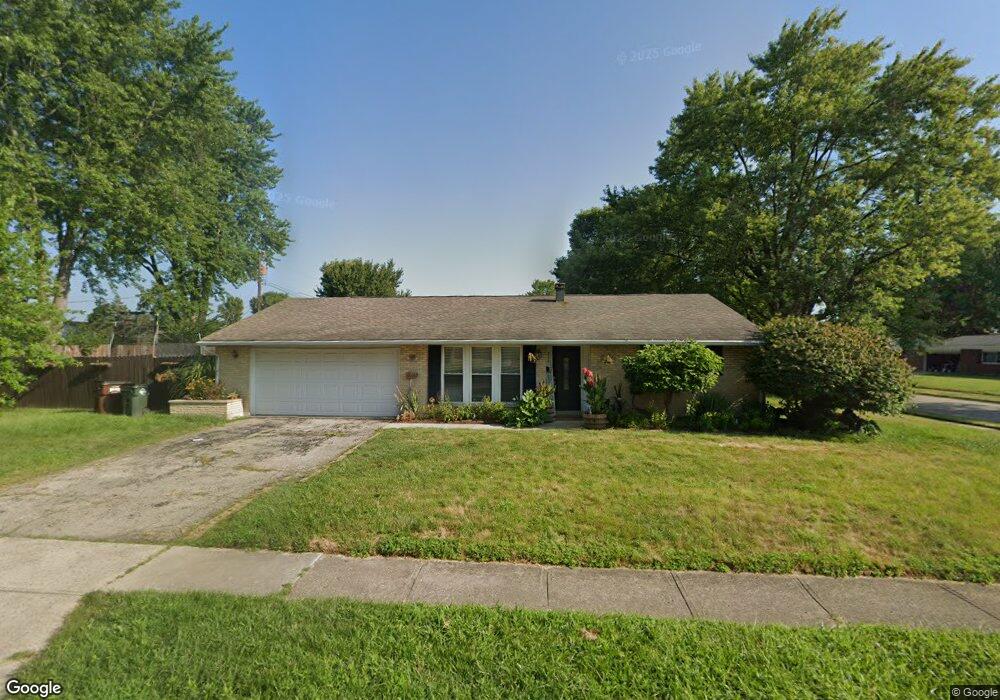
218 Porter Dr Englewood, OH 45322
Estimated Value: $187,000 - $212,000
3
Beds
2
Baths
1,374
Sq Ft
$148/Sq Ft
Est. Value
About This Home
This home is located at 218 Porter Dr, Englewood, OH 45322 and is currently estimated at $203,410, approximately $148 per square foot. 218 Porter Dr is a home located in Montgomery County with nearby schools including Englewood Hills Elementary School, Northmont High School, and Trotwood Preparatory & Fitness Academy.
Ownership History
Date
Name
Owned For
Owner Type
Purchase Details
Closed on
Dec 15, 2020
Sold by
Hellstrom Jeanne
Bought by
Hellstrom Jeffrey Joshua
Current Estimated Value
Home Financials for this Owner
Home Financials are based on the most recent Mortgage that was taken out on this home.
Original Mortgage
$114,000
Interest Rate
2.6%
Mortgage Type
New Conventional
Purchase Details
Closed on
Mar 21, 2018
Sold by
Rrcap Sfr Ii Llc
Bought by
Hellstrom Jeanne
Home Financials for this Owner
Home Financials are based on the most recent Mortgage that was taken out on this home.
Original Mortgage
$95,200
Interest Rate
4.46%
Mortgage Type
New Conventional
Purchase Details
Closed on
Aug 30, 2016
Sold by
Dc Residential Acquisition Company Llc
Bought by
Rrcap Sfr Ii Llc
Home Financials for this Owner
Home Financials are based on the most recent Mortgage that was taken out on this home.
Original Mortgage
$50,000,000
Interest Rate
3.43%
Mortgage Type
Future Advance Clause Open End Mortgage
Purchase Details
Closed on
Aug 29, 2016
Sold by
Christiana Trust
Bought by
Dc Residential Acquisition Company Llc
Home Financials for this Owner
Home Financials are based on the most recent Mortgage that was taken out on this home.
Original Mortgage
$50,000,000
Interest Rate
3.43%
Mortgage Type
Future Advance Clause Open End Mortgage
Purchase Details
Closed on
May 12, 2014
Sold by
Sims Aimee N and Bank Of America Na
Bought by
Christiana Trust
Purchase Details
Closed on
May 6, 2010
Sold by
Robinson Charles G and Robinson Frances A
Bought by
Sims Aimee N
Home Financials for this Owner
Home Financials are based on the most recent Mortgage that was taken out on this home.
Original Mortgage
$82,883
Interest Rate
5.16%
Mortgage Type
FHA
Purchase Details
Closed on
Oct 22, 2003
Sold by
Blasko Brian R and Blasko Tamatha
Bought by
Robinson Charles G and Robinson Frances A
Purchase Details
Closed on
Dec 21, 1998
Sold by
Macey Cynthia H
Bought by
Blasko Brian R
Home Financials for this Owner
Home Financials are based on the most recent Mortgage that was taken out on this home.
Original Mortgage
$90,400
Interest Rate
6.83%
Mortgage Type
FHA
Purchase Details
Closed on
Jun 19, 1995
Sold by
Krumlauf Tamara F
Bought by
Sitler Frances Jane and Krumlauf Frances Jane
Purchase Details
Closed on
Jun 16, 1995
Sold by
Sitler Frances Jane and Krumlauf Frances Jane
Bought by
Macey Cynthia H
Create a Home Valuation Report for This Property
The Home Valuation Report is an in-depth analysis detailing your home's value as well as a comparison with similar homes in the area
Home Values in the Area
Average Home Value in this Area
Purchase History
| Date | Buyer | Sale Price | Title Company |
|---|---|---|---|
| Hellstrom Jeffrey Joshua | $120,000 | Prodigy Title Agency | |
| Hellstrom Jeanne | $112,000 | Landmark Title Agency South | |
| Rrcap Sfr Ii Llc | $85,800 | Areawide Title | |
| Dc Residential Acquisition Company Llc | -- | Areawide Title | |
| Christiana Trust | $59,000 | None Available | |
| Sims Aimee N | $84,000 | Attorney | |
| Robinson Charles G | $102,000 | -- | |
| Blasko Brian R | $90,500 | -- | |
| Sitler Frances Jane | -- | Landmark Title | |
| Macey Cynthia H | -- | Landmark Title | |
| Sitler Frances Jane | -- | Landmark Title |
Source: Public Records
Mortgage History
| Date | Status | Borrower | Loan Amount |
|---|---|---|---|
| Previous Owner | Hellstrom Jeffrey Joshua | $114,000 | |
| Previous Owner | Hellstrom Jeanne | $95,200 | |
| Previous Owner | Rrcap Sfr Ii Llc | $50,000,000 | |
| Previous Owner | Dc Residential Acquisition Company Llc | $50,000,000 | |
| Previous Owner | Sims Aimee N | $82,883 | |
| Previous Owner | Blasko Brian R | $90,400 |
Source: Public Records
Tax History Compared to Growth
Tax History
| Year | Tax Paid | Tax Assessment Tax Assessment Total Assessment is a certain percentage of the fair market value that is determined by local assessors to be the total taxable value of land and additions on the property. | Land | Improvement |
|---|---|---|---|---|
| 2024 | $3,114 | $54,570 | $11,930 | $42,640 |
| 2023 | $3,114 | $54,570 | $11,930 | $42,640 |
| 2022 | $2,846 | $38,370 | $8,400 | $29,970 |
| 2021 | $2,854 | $38,370 | $8,400 | $29,970 |
| 2020 | $2,870 | $38,370 | $8,400 | $29,970 |
| 2019 | $2,622 | $31,430 | $9,660 | $21,770 |
| 2018 | $2,515 | $31,430 | $9,660 | $21,770 |
| 2017 | $2,497 | $31,430 | $9,660 | $21,770 |
| 2016 | $2,499 | $30,130 | $8,400 | $21,730 |
| 2015 | $3,032 | $30,130 | $8,400 | $21,730 |
| 2014 | $3,032 | $30,130 | $8,400 | $21,730 |
| 2012 | -- | $32,630 | $8,400 | $24,230 |
Source: Public Records
Map
Nearby Homes
- 1017 Terracewood Dr
- 174 Candle Ct Unit 12
- 178 Candle Ct Unit 14
- 229 Brookwood Dr
- 1008 Merrywood Dr
- 117 Candle Ct Unit 740
- 1010 Heathwood Dr
- 4161 Gorman Ave
- 4220 Pleasanton Rd
- 0 Taywood Rd
- 4230 Pleasanton Rd
- 7201 Mckenna Place
- 7196 Dominican Dr
- 505 Durst Dr
- 7012 Stillmore Dr
- 7171 Dominican Dr
- 510 Lambert Ln
- 718 Bonnycastle Ave
- 717 Woodlawn Ave
- 7000 Kinsey Rd
- 216 Porter Dr
- 1015 McQuillan Dr
- 1037 Terracewood Dr
- 1035 Terracewood Dr
- 214 Porter Dr
- 221 Porter Dr
- 219 Porter Dr
- 1013 McQuillan Dr
- 223 Porter Dr
- 1010 McQuillan Dr
- 217 Porter Dr
- 1033 Terracewood Dr
- 1008 Mc Quillan Dr
- 1008 McQuillan Dr
- 212 Porter Dr
- 1043 Heathwood Dr
- 215 Porter Dr
- 1034 Terracewood Dr
- 225 Porter Dr
- 1031 Terracewood Dr