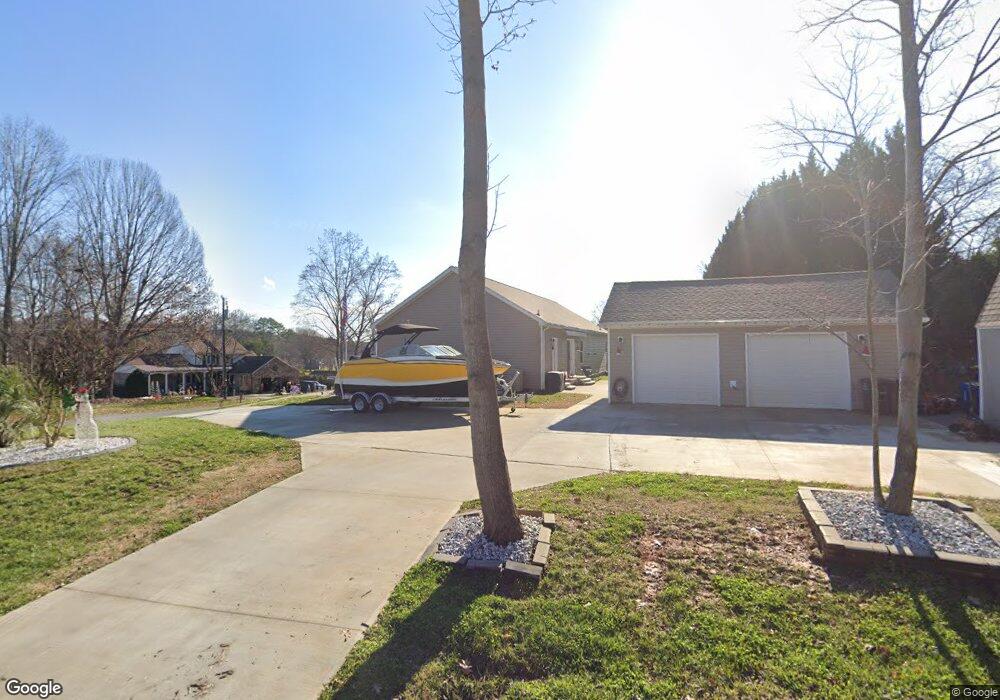
218 Regency Rd Unit 7 Mooresville, NC 28117
Estimated Value: $336,000 - $613,000
3
Beds
2
Baths
2,040
Sq Ft
$241/Sq Ft
Est. Value
About This Home
This home is located at 218 Regency Rd Unit 7, Mooresville, NC 28117 and is currently estimated at $490,903, approximately $240 per square foot. 218 Regency Rd Unit 7 is a home located in Iredell County with nearby schools including Lake Norman Elementary School and Lake Norman High School.
Ownership History
Date
Name
Owned For
Owner Type
Purchase Details
Closed on
Sep 26, 2017
Sold by
Cmh Homes Inc
Bought by
Syverson Gregory D and Syverson Christina
Current Estimated Value
Home Financials for this Owner
Home Financials are based on the most recent Mortgage that was taken out on this home.
Original Mortgage
$198,455
Outstanding Balance
$164,883
Interest Rate
3.89%
Mortgage Type
New Conventional
Estimated Equity
$326,020
Purchase Details
Closed on
Jun 23, 2017
Sold by
Mcguffey Roger D and Mcguffey Kelli C
Bought by
Cmh Homes Inc A Tn Corporation
Purchase Details
Closed on
Aug 1, 2005
Sold by
Mcguffey Roger D and Mcguffey Kelli C
Bought by
Efc Associates Inc
Home Financials for this Owner
Home Financials are based on the most recent Mortgage that was taken out on this home.
Original Mortgage
$55,325
Interest Rate
5.51%
Mortgage Type
Construction
Purchase Details
Closed on
Jan 1, 1995
Purchase Details
Closed on
Apr 1, 1989
Purchase Details
Closed on
Jun 1, 1973
Create a Home Valuation Report for This Property
The Home Valuation Report is an in-depth analysis detailing your home's value as well as a comparison with similar homes in the area
Home Values in the Area
Average Home Value in this Area
Purchase History
| Date | Buyer | Sale Price | Title Company |
|---|---|---|---|
| Syverson Gregory D | $209,000 | None Available | |
| Cmh Homes Inc A Tn Corporation | $47,000 | None Available | |
| Efc Associates Inc | $52,000 | -- | |
| -- | $10,000 | -- | |
| -- | $10,000 | -- | |
| -- | -- | -- |
Source: Public Records
Mortgage History
| Date | Status | Borrower | Loan Amount |
|---|---|---|---|
| Open | Syverson Gregory D | $198,455 | |
| Previous Owner | Efc Associates Inc | $55,325 |
Source: Public Records
Tax History Compared to Growth
Tax History
| Year | Tax Paid | Tax Assessment Tax Assessment Total Assessment is a certain percentage of the fair market value that is determined by local assessors to be the total taxable value of land and additions on the property. | Land | Improvement |
|---|---|---|---|---|
| 2025 | $2,169 | $357,510 | $65,000 | $292,510 |
| 2024 | $2,169 | $357,510 | $65,000 | $292,510 |
| 2023 | $2,169 | $357,510 | $65,000 | $292,510 |
| 2022 | $1,553 | $237,880 | $45,000 | $192,880 |
| 2021 | $1,549 | $237,880 | $45,000 | $192,880 |
| 2020 | $1,549 | $237,880 | $45,000 | $192,880 |
| 2019 | $1,525 | $237,880 | $45,000 | $192,880 |
| 2018 | $1,161 | $185,540 | $35,000 | $150,540 |
| 2017 | $209 | $35,000 | $35,000 | $0 |
| 2016 | $209 | $35,000 | $35,000 | $0 |
| 2015 | $209 | $35,000 | $35,000 | $0 |
| 2014 | $194 | $35,000 | $35,000 | $0 |
Source: Public Records
Map
Nearby Homes
- 127 Hazelton Loop
- 227 Corona Cir Unit 19
- 156 Hazelton Loop
- 214 Farmstead Ln
- 151 Turnberry Ln
- 175 Corona Cir
- 188 Turnberry Ln
- 147 Sundown Rd
- 110 Old Squaw Rd
- 350 Sundown Rd
- 315 Wood Duck Loop
- 168 Mooreland Rd
- 105 Crystal Cir
- 147 Old Squaw Rd
- 155 Samdusky Ln
- 195 Pamlico Ln
- 125 Oak Village Pkwy
- 258 Crystal Cir
- 110 Whitehall Dr
- 118 Broadbill Dr
- 212 Regency Rd
- 208 Regency Rd
- 121 Shall Mar Ln
- 196 Hazelton Loop
- 213 Regency Rd
- 200 Hazelton Loop
- 204 Hazelton Loop
- 190 Hazelton Loop
- 186 Hazelton Loop
- 211 Regency Rd
- 117 Shall Mar Ln
- 203 Regency Rd
- 179 Hazelton Loop
- 182 Hazelton Loop
- 111 Shall Mar Ln
- 170 Inverness Loop
- 199 Regency Rd
- 176 Hazelton Loop
- 176 Hazelton Loop Unit 13
- 175 Hazelton Loop