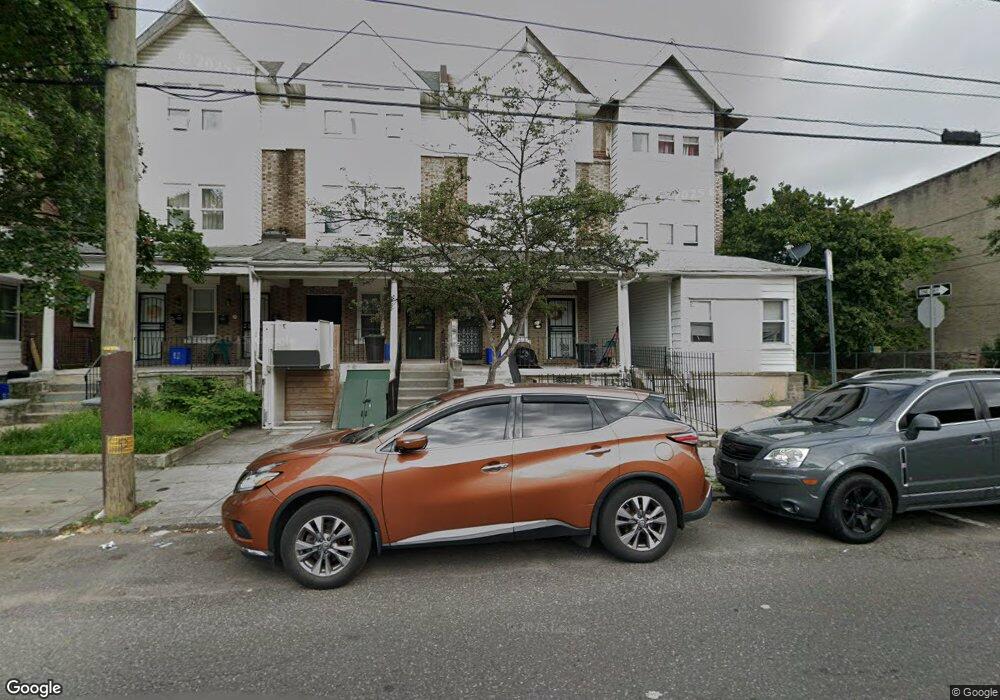
218 S 50th St Philadelphia, PA 19139
Cobbs Creek NeighborhoodEstimated Value: $356,000 - $443,863
4
Beds
2
Baths
1,872
Sq Ft
$209/Sq Ft
Est. Value
About This Home
This home is located at 218 S 50th St, Philadelphia, PA 19139 and is currently estimated at $391,288, approximately $209 per square foot. 218 S 50th St is a home located in Philadelphia County with nearby schools including William L. Sayre High School, Global Leadership Academy Charter School Southwest, and The Islamic Education School (TIES).
Ownership History
Date
Name
Owned For
Owner Type
Purchase Details
Closed on
Sep 4, 2013
Sold by
Cross Francine
Bought by
Willis Jeffery
Current Estimated Value
Home Financials for this Owner
Home Financials are based on the most recent Mortgage that was taken out on this home.
Original Mortgage
$193,922
Outstanding Balance
$143,848
Interest Rate
4.25%
Mortgage Type
FHA
Estimated Equity
$247,440
Purchase Details
Closed on
Apr 26, 2010
Sold by
Ripkin Mitchell
Bought by
Cross Francine
Home Financials for this Owner
Home Financials are based on the most recent Mortgage that was taken out on this home.
Original Mortgage
$200,000
Interest Rate
5.11%
Mortgage Type
Future Advance Clause Open End Mortgage
Purchase Details
Closed on
Jan 26, 2009
Sold by
Brittingham Denise L and City Of Philadelphia
Bought by
Ripkin Mitchell
Create a Home Valuation Report for This Property
The Home Valuation Report is an in-depth analysis detailing your home's value as well as a comparison with similar homes in the area
Home Values in the Area
Average Home Value in this Area
Purchase History
| Date | Buyer | Sale Price | Title Company |
|---|---|---|---|
| Willis Jeffery | $197,500 | None Available | |
| Cross Francine | $62,500 | None Available | |
| Ripkin Mitchell | $39,500 | None Available |
Source: Public Records
Mortgage History
| Date | Status | Borrower | Loan Amount |
|---|---|---|---|
| Open | Willis Jeffery | $193,922 | |
| Previous Owner | Cross Francine | $200,000 |
Source: Public Records
Tax History Compared to Growth
Tax History
| Year | Tax Paid | Tax Assessment Tax Assessment Total Assessment is a certain percentage of the fair market value that is determined by local assessors to be the total taxable value of land and additions on the property. | Land | Improvement |
|---|---|---|---|---|
| 2025 | $4,331 | $339,200 | $67,800 | $271,400 |
| 2024 | $4,331 | $339,200 | $67,800 | $271,400 |
| 2023 | $4,331 | $309,400 | $61,880 | $247,520 |
| 2022 | $2,473 | $264,400 | $61,880 | $202,520 |
| 2021 | $3,103 | $0 | $0 | $0 |
| 2020 | $3,103 | $0 | $0 | $0 |
| 2019 | $2,987 | $0 | $0 | $0 |
| 2018 | $2,175 | $0 | $0 | $0 |
| 2017 | $2,175 | $0 | $0 | $0 |
| 2016 | $2,175 | $0 | $0 | $0 |
| 2015 | $2,082 | $0 | $0 | $0 |
| 2014 | -- | $155,400 | $15,320 | $140,080 |
| 2012 | -- | $8,224 | $2,155 | $6,069 |
Source: Public Records
Map
Nearby Homes
- 5005 Walnut St
- 5027 Spruce St
- 248 S Saint Bernard St
- 5107 Chancellor St
- 4915 Chancellor St
- 4913 Chancellor St
- 5128 Locust St
- 4906 Walnut St
- 5142 Locust St
- 5140 Irving St
- 211 S 49th St
- 5133 Spruce St
- 5040 Chestnut St
- 5143-45 Irving St
- 4957 Pine St
- 257 S 52nd St
- 4935 Pine St
- 5134 Spruce St
- 137 S 49th St
- 4914 Chestnut St
- 220 S 50th St
- 216 S 50th St
- 222 S 50th St
- 224 S 50th St
- 226 S 50th St
- 212 S 50th St Unit 2
- 212 S 50th St
- 5014 Chancellor St
- 5016 Chancellor St
- 210 S 50th St
- 228 S 50th St
- 228 S 50th St Unit 2
- 228 S 50th St Unit 7
- 228 S 50th St Unit G1
- 5011 Locust St
- 5009 Chancellor St
- 5018 Chancellor St
- 5011 Chancellor St
- 5013 Locust St
- 5013 Chancellor St