Estimated Value: $104,394 - $176,000
--
Bed
--
Bath
2,169
Sq Ft
$65/Sq Ft
Est. Value
About This Home
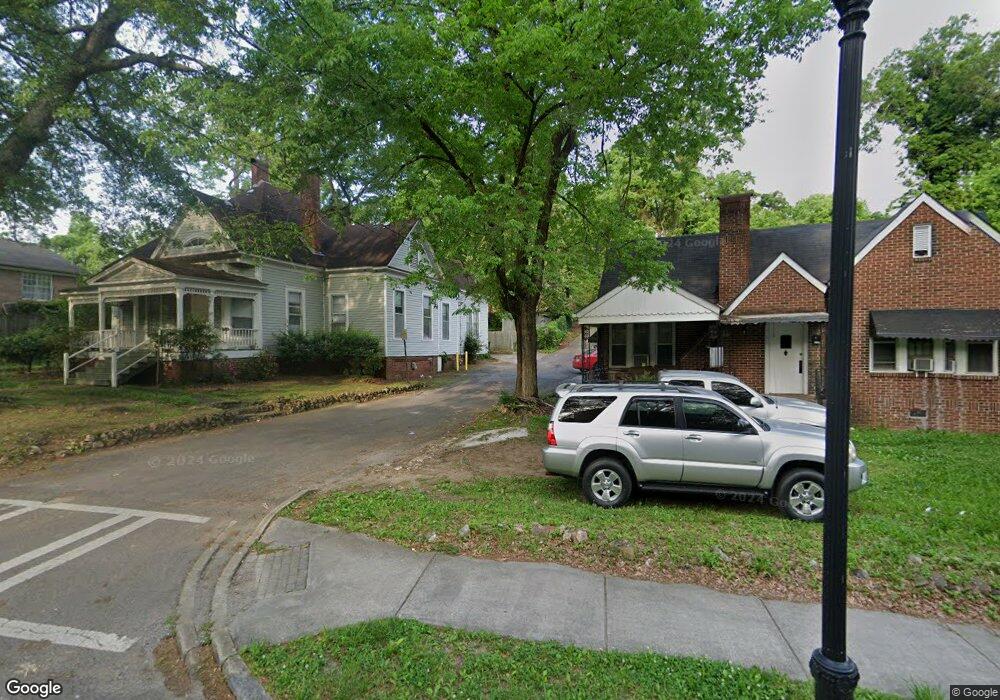
This home is located at 218 S Broad St SW, Rome, GA 30161 and is currently estimated at $140,849, approximately $64 per square foot. 218 S Broad St SW is a home with nearby schools including Dan McCarty Middle School, Rome High School, and Darlington School.
Ownership History
Date
Name
Owned For
Owner Type
Purchase Details
Closed on
Apr 12, 2019
Sold by
Garcia Edwin
Bought by
Garcia Jose H and South Rome Preservation Trust
Current Estimated Value
Purchase Details
Closed on
Aug 12, 2010
Sold by
Frazier Mel Corwyn
Bought by
Floydco Westwood Holdings Llc
Purchase Details
Closed on
Aug 11, 1998
Sold by
Frazier Cary L
Bought by
Frazier Tommie C
Purchase Details
Closed on
Mar 17, 1988
Sold by
Mccray Ida
Bought by
Frazier Cary L
Purchase Details
Closed on
Dec 21, 1984
Sold by
Administratior Of Veterans Affairs
Bought by
Mccray Ida
Purchase Details
Closed on
Aug 7, 1984
Sold by
Collateral Investment Company
Bought by
Administratior Of Veterans Affairs
Purchase Details
Closed on
Sep 8, 1978
Sold by
Moore Mildred Lee Watson
Bought by
Gordon John and Gordon Louise
Create a Home Valuation Report for This Property
The Home Valuation Report is an in-depth analysis detailing your home's value as well as a comparison with similar homes in the area
Home Values in the Area
Average Home Value in this Area
Purchase History
| Date | Buyer | Sale Price | Title Company |
|---|---|---|---|
| Garcia Jose H | -- | -- | |
| Garcia Edwin | $45,500 | -- | |
| Floydco Westwood Holdings Llc | -- | -- | |
| Frazier Mel Corwyn | -- | -- | |
| Frazier Tommie C | -- | -- | |
| Frazier Cary L | -- | -- | |
| Mccray Ida | $25,000 | -- | |
| Administratior Of Veterans Affairs | $25,000 | -- | |
| Collateral Investment Company | $25,500 | -- | |
| Gordon John | -- | -- | |
| Moore Mildred Lee Watson | -- | -- | |
| Moore Moore H | $27,900 | -- |
Source: Public Records
Tax History Compared to Growth
Tax History
| Year | Tax Paid | Tax Assessment Tax Assessment Total Assessment is a certain percentage of the fair market value that is determined by local assessors to be the total taxable value of land and additions on the property. | Land | Improvement |
|---|---|---|---|---|
| 2024 | $1,120 | $28,750 | $4,894 | $23,856 |
| 2023 | $1,018 | $27,239 | $4,450 | $22,789 |
| 2022 | $811 | $22,220 | $3,560 | $18,660 |
| 2021 | $743 | $20,017 | $3,560 | $16,457 |
| 2020 | $681 | $19,665 | $2,781 | $16,884 |
| 2019 | $1,002 | $27,077 | $2,781 | $24,296 |
| 2018 | $1,002 | $27,077 | $2,781 | $24,296 |
| 2017 | $1,002 | $27,077 | $2,781 | $24,296 |
| 2016 | $1,019 | $27,432 | $3,160 | $24,272 |
| 2015 | $963 | $27,432 | $3,160 | $24,272 |
| 2014 | $963 | $27,468 | $3,160 | $24,308 |
Source: Public Records
Map
Nearby Homes
- 232 S Broad St SW
- 105 Mary St SW
- 110 Cherokee St SW
- 235 Pennington Ave SW
- 334 Branham Ave SW
- 204 Myrtle St SW
- 107 Butler St SW
- 515 S Broad St SW
- 515 Harper Ave SW
- 115 Lookout Cir SW
- 101 Hardy Ave SW
- 3 Grover St SW
- 113 Lookout Cir SW
- 111 Lookout Cir SW
- 410 Hardy Ave SW
- 515 Hardy Ave SW
- 8 E 3rd Ave
- 10 E 3rd Ave
- 216 S Broad St SW
- 3 Coosa St SW
- 212 & 214 S Broad St SW
- 105 Klassing St SW
- 212 S Broad St SW
- 230 S Broad St SW
- 3 Coosa St SW
- 103 Klassing St SW
- 141 Cherokee St SW Unit 2
- 14 Cherokee St SW
- 211 S Broad St SW
- 16 Cherokee St SW
- 210 S Broad St SW
- 81 Klassing St SW
- 18 Cherokee St SW
- 106 Klassing St SW
- 213 S Broad St SW
- 213 Broad St
- 213 Broad St
- 221 S Broad St SW