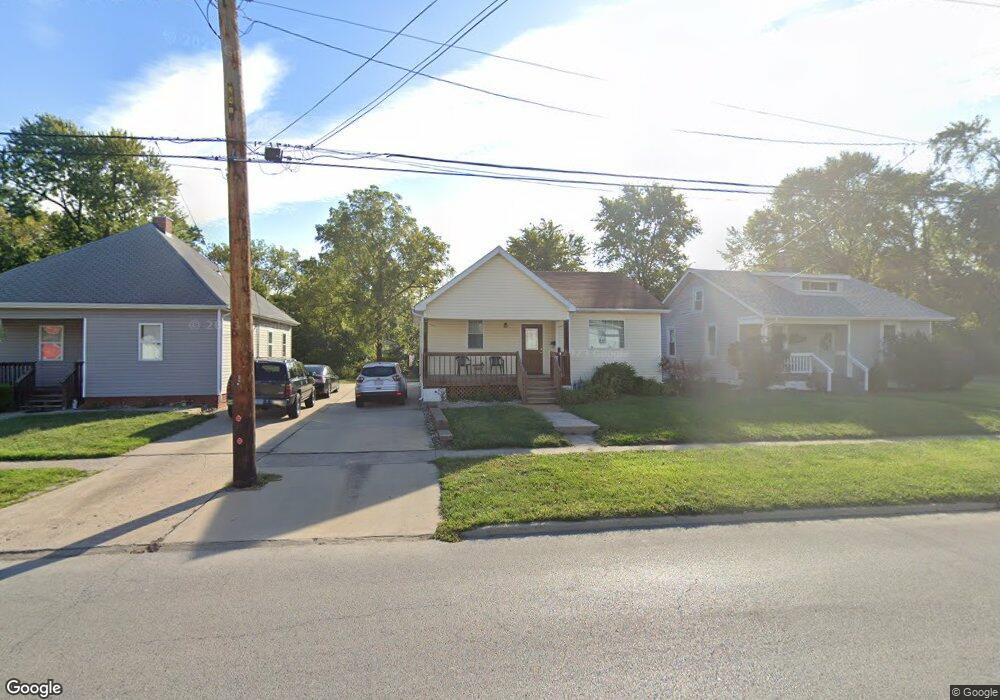
218 S Combs Ave Collinsville, IL 62234
Estimated Value: $104,000 - $141,000
2
Beds
1
Bath
834
Sq Ft
$146/Sq Ft
Est. Value
About This Home
This home is located at 218 S Combs Ave, Collinsville, IL 62234 and is currently estimated at $121,849, approximately $146 per square foot. 218 S Combs Ave is a home located in Madison County with nearby schools including Webster Elementary School, Dorris Intermediate School, and Collinsville Middle School.
Ownership History
Date
Name
Owned For
Owner Type
Purchase Details
Closed on
Mar 20, 2014
Sold by
Tarrant Dennis A and Tarrant Theresa M
Bought by
Cedar Series Ddd Holdings Llc
Current Estimated Value
Purchase Details
Closed on
Aug 9, 2011
Sold by
Federal Home Loan Mortgage Corporation
Bought by
Tarrant Dennis A
Purchase Details
Closed on
Jun 22, 2010
Sold by
Madden Jason C
Bought by
Federal Home Loan Mortgage Corp
Purchase Details
Closed on
Apr 27, 2004
Sold by
Phetsadasack Somhack and Phetsadasack Rhonda
Bought by
Madden Jason C and Madden Corinne C
Home Financials for this Owner
Home Financials are based on the most recent Mortgage that was taken out on this home.
Original Mortgage
$54,000
Interest Rate
8.3%
Mortgage Type
Purchase Money Mortgage
Create a Home Valuation Report for This Property
The Home Valuation Report is an in-depth analysis detailing your home's value as well as a comparison with similar homes in the area
Home Values in the Area
Average Home Value in this Area
Purchase History
| Date | Buyer | Sale Price | Title Company |
|---|---|---|---|
| Cedar Series Ddd Holdings Llc | -- | None Available | |
| Tarrant Dennis A | $22,000 | Metro Title & Escrow Co | |
| Federal Home Loan Mortgage Corp | -- | None Available | |
| Madden Jason C | $60,000 | -- |
Source: Public Records
Mortgage History
| Date | Status | Borrower | Loan Amount |
|---|---|---|---|
| Previous Owner | Madden Jason C | $54,000 |
Source: Public Records
Tax History Compared to Growth
Tax History
| Year | Tax Paid | Tax Assessment Tax Assessment Total Assessment is a certain percentage of the fair market value that is determined by local assessors to be the total taxable value of land and additions on the property. | Land | Improvement |
|---|---|---|---|---|
| 2024 | $2,016 | $31,540 | $7,090 | $24,450 |
| 2023 | $2,016 | $28,820 | $6,450 | $22,370 |
| 2022 | $1,897 | $26,650 | $5,960 | $20,690 |
| 2021 | $1,730 | $25,040 | $5,600 | $19,440 |
| 2020 | $1,668 | $23,890 | $5,340 | $18,550 |
| 2019 | $1,875 | $26,650 | $5,140 | $21,510 |
| 2018 | $1,833 | $25,250 | $4,870 | $20,380 |
| 2017 | $1,835 | $24,740 | $4,770 | $19,970 |
| 2016 | $1,933 | $24,740 | $4,770 | $19,970 |
| 2015 | $1,543 | $24,100 | $4,650 | $19,450 |
| 2014 | $1,543 | $20,610 | $5,000 | $15,610 |
| 2013 | $1,543 | $20,610 | $5,000 | $15,610 |
Source: Public Records
Map
Nearby Homes
- 125 S Hesperia St
- 611 W Main St
- 746 Maple St
- 126 Collinsville Ave
- 119 N Hesperia St
- 506 W Clay St
- 221 N Hesperia St Unit 221 A and 221 B
- 820 Bond Ave
- 121 S Seminary St
- 714 Lillian St
- 419 Bell St
- 300 N Combs Ave
- Lot 32 Jefferson Ave
- 0 Elm St
- 205 Audrey Ave
- Lot 37 Jefferson Ave
- Lot 38 Jefferson Ave
- Lot 36 Jefferson Ave
- Lot 20 Jefferson Ave
- 128 Courtland Place
- 216 S Combs Ave
- 220 S Combs Ave
- 715 Cedar St
- 212 S Combs Ave
- 801 Cedar St
- 310 S Combs Ave
- 206 S Combs Ave
- 124 Saint Louis Rd
- 800 Cedar St
- 204 S Combs Ave
- 312 S Combs Ave
- 704 Staten St
- 704 Staten St
- 806 Cedar St
- 806 Cedar St Unit A&B
- 202 S Combs Ave
- 314 S Combs Ave
- 723 Staten St
- 313 S Combs Ave
- 204 St Louis Rd