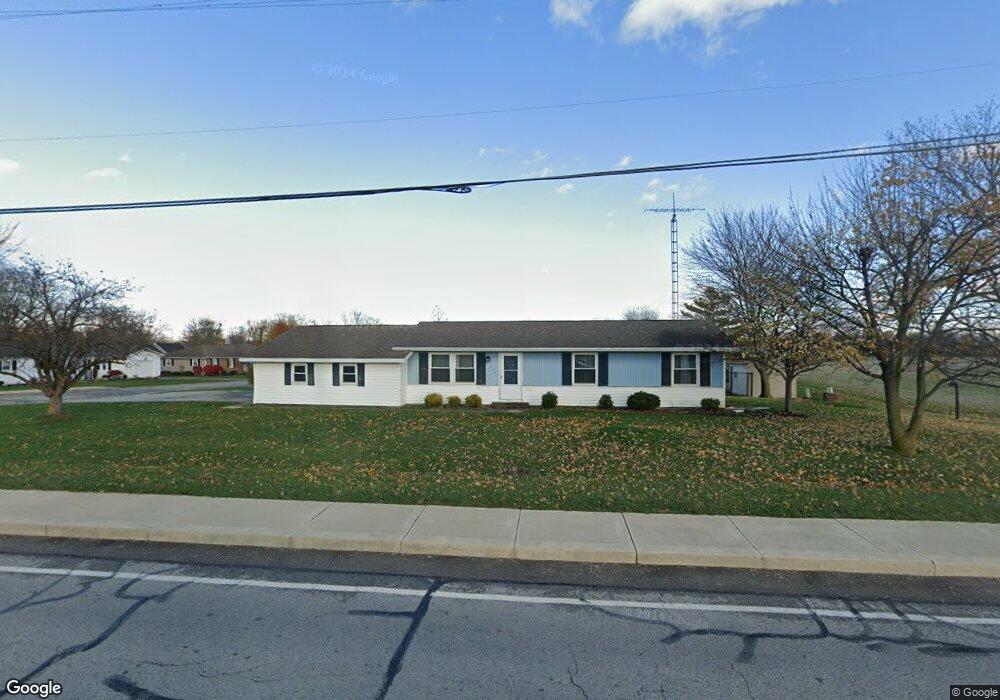
218 S Main St Botkins, OH 45306
Estimated Value: $176,878 - $231,000
3
Beds
2
Baths
1,056
Sq Ft
$187/Sq Ft
Est. Value
About This Home
This home is located at 218 S Main St, Botkins, OH 45306 and is currently estimated at $197,220, approximately $186 per square foot. 218 S Main St is a home located in Shelby County with nearby schools including Botkins Elementary School and Botkins High School.
Ownership History
Date
Name
Owned For
Owner Type
Purchase Details
Closed on
Jan 29, 2024
Sold by
Billing Connor J and Billing Cassandra M
Bought by
Bergman Lucas J
Current Estimated Value
Purchase Details
Closed on
Apr 30, 2021
Sold by
Billing Jo A and Billing David W
Bought by
Billing Connor J and Bergman Cassandra M
Home Financials for this Owner
Home Financials are based on the most recent Mortgage that was taken out on this home.
Original Mortgage
$100,000
Interest Rate
3.1%
Mortgage Type
Closed End Mortgage
Purchase Details
Closed on
May 25, 2005
Sold by
Egbert Ronald and Egbert Donna
Bought by
Billing Jo A
Home Financials for this Owner
Home Financials are based on the most recent Mortgage that was taken out on this home.
Original Mortgage
$87,250
Interest Rate
5.91%
Mortgage Type
Purchase Money Mortgage
Purchase Details
Closed on
Dec 23, 2002
Sold by
Miller Donald
Bought by
Egbert Ronald
Create a Home Valuation Report for This Property
The Home Valuation Report is an in-depth analysis detailing your home's value as well as a comparison with similar homes in the area
Purchase History
| Date | Buyer | Sale Price | Title Company |
|---|---|---|---|
| Bergman Lucas J | $130,000 | None Listed On Document | |
| Billing Connor J | $110,000 | None Available | |
| Billing Jo A | $87,250 | None Available | |
| Egbert Ronald | $67,500 | -- |
Source: Public Records
Mortgage History
| Date | Status | Borrower | Loan Amount |
|---|---|---|---|
| Previous Owner | Billing Connor J | $100,000 | |
| Previous Owner | Billing Jo A | $87,250 |
Source: Public Records
Tax History
| Year | Tax Paid | Tax Assessment Tax Assessment Total Assessment is a certain percentage of the fair market value that is determined by local assessors to be the total taxable value of land and additions on the property. | Land | Improvement |
|---|---|---|---|---|
| 2025 | $1,478 | $45,290 | $10,850 | $34,440 |
| 2024 | $1,478 | $45,290 | $10,850 | $34,440 |
| 2023 | $1,500 | $45,290 | $10,850 | $34,440 |
| 2022 | $1,437 | $37,760 | $8,560 | $29,200 |
| 2021 | $1,101 | $37,760 | $8,560 | $29,200 |
| 2020 | $1,117 | $37,760 | $8,560 | $29,200 |
| 2019 | $850 | $31,080 | $7,250 | $23,830 |
| 2018 | $834 | $31,080 | $7,250 | $23,830 |
| 2017 | $839 | $31,080 | $7,250 | $23,830 |
| 2016 | $754 | $28,970 | $7,250 | $21,720 |
| 2015 | $748 | $28,970 | $7,250 | $21,720 |
| 2014 | $748 | $28,970 | $7,250 | $21,720 |
| 2013 | $735 | $27,940 | $7,250 | $20,690 |
Source: Public Records
Map
Nearby Homes
- 321 S Main St
- 407 E South St
- 19211 State Route 219
- 15031 Ohio 119
- 102 E Main St
- 101 W South St
- 205 S 2nd St
- 14333 Meranda Rd
- 13358 Bornhorst Rd
- 13400 Whitefeather Trail
- 917 Sunrise Dr
- 0 Geyer Dr
- 101 Island Ave
- 105 E Pearl St
- 602 W Benton St
- 1100 W Auglaize St
- 404 W Pearl St
- 608 W Pearl St
- 8 S Seltzer St
- 114 Cherry Ln
Your Personal Tour Guide
Ask me questions while you tour the home.