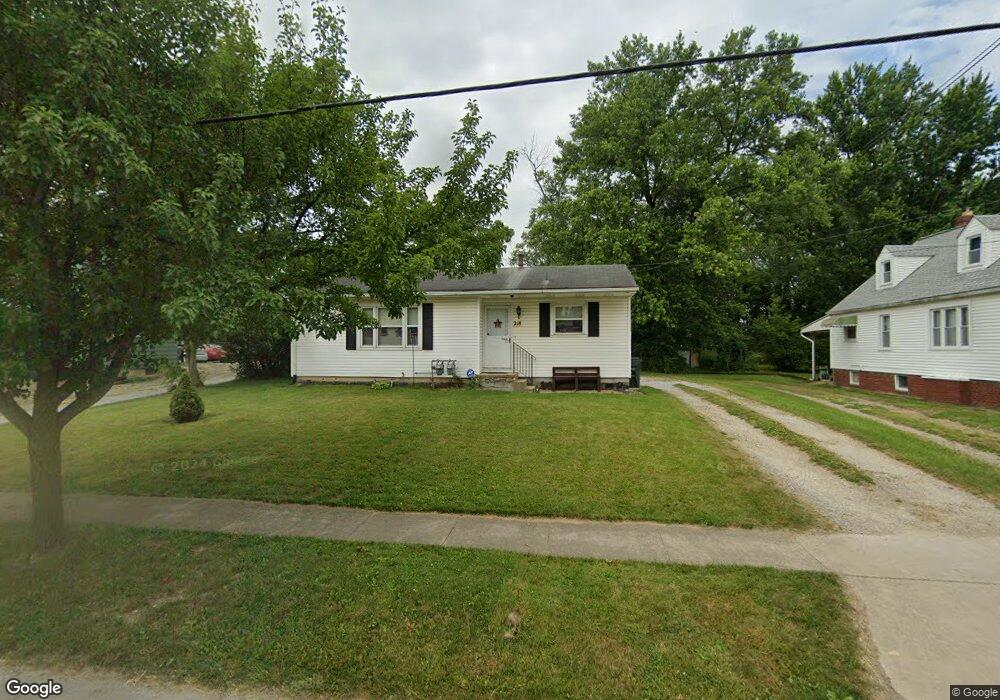
218 S Main St Creston, OH 44217
Estimated Value: $91,000 - $196,000
2
Beds
1
Bath
832
Sq Ft
$178/Sq Ft
Est. Value
About This Home
This home is located at 218 S Main St, Creston, OH 44217 and is currently estimated at $148,405, approximately $178 per square foot. 218 S Main St is a home located in Wayne County with nearby schools including Norwayne Elementary School, Norwayne Middle School, and Norwayne High School.
Ownership History
Date
Name
Owned For
Owner Type
Purchase Details
Closed on
May 13, 1999
Sold by
Gohara Wadie F
Bought by
Schulz Kevin
Current Estimated Value
Home Financials for this Owner
Home Financials are based on the most recent Mortgage that was taken out on this home.
Original Mortgage
$66,300
Outstanding Balance
$17,131
Interest Rate
7.04%
Mortgage Type
New Conventional
Estimated Equity
$131,274
Purchase Details
Closed on
Aug 21, 1996
Sold by
Luntsford Brian K
Bought by
Gohara Wadie F and Gohara Samia A
Home Financials for this Owner
Home Financials are based on the most recent Mortgage that was taken out on this home.
Original Mortgage
$52,800
Interest Rate
6.5%
Mortgage Type
New Conventional
Purchase Details
Closed on
Mar 21, 1995
Sold by
Wilson William M
Bought by
Luntsford Brian K
Purchase Details
Closed on
Apr 15, 1992
Sold by
O'Higgins Michael K and O'Higgins Che
Bought by
Wilson William M and Wilson Marily
Purchase Details
Closed on
Sep 21, 1989
Sold by
Bowman Gary L and Bowman Inez M
Bought by
O'Higgins Michael K and O'Higgins Che
Create a Home Valuation Report for This Property
The Home Valuation Report is an in-depth analysis detailing your home's value as well as a comparison with similar homes in the area
Purchase History
| Date | Buyer | Sale Price | Title Company |
|---|---|---|---|
| Schulz Kevin | $78,000 | -- | |
| Gohara Wadie F | $66,000 | -- | |
| Luntsford Brian K | $58,000 | -- | |
| Wilson William M | $45,000 | -- | |
| O'Higgins Michael K | $41,000 | -- |
Source: Public Records
Mortgage History
| Date | Status | Borrower | Loan Amount |
|---|---|---|---|
| Open | Schulz Kevin | $66,300 | |
| Previous Owner | Gohara Wadie F | $52,800 |
Source: Public Records
Tax History
| Year | Tax Paid | Tax Assessment Tax Assessment Total Assessment is a certain percentage of the fair market value that is determined by local assessors to be the total taxable value of land and additions on the property. | Land | Improvement |
|---|---|---|---|---|
| 2024 | $1,893 | $43,250 | $13,480 | $29,770 |
| 2023 | $1,935 | $43,250 | $13,480 | $29,770 |
| 2022 | $1,674 | $33,020 | $10,290 | $22,730 |
| 2021 | $1,521 | $33,020 | $10,290 | $22,730 |
| 2020 | $1,532 | $33,020 | $10,290 | $22,730 |
| 2019 | $1,556 | $34,070 | $10,290 | $23,780 |
| 2018 | $1,564 | $34,070 | $10,290 | $23,780 |
| 2017 | $1,554 | $34,070 | $10,290 | $23,780 |
| 2016 | $1,419 | $31,910 | $10,290 | $21,620 |
| 2015 | $1,408 | $31,910 | $10,290 | $21,620 |
| 2014 | $1,421 | $31,910 | $10,290 | $21,620 |
| 2013 | $1,470 | $32,090 | $10,180 | $21,910 |
Source: Public Records
Map
Nearby Homes
- 124 Garden St
- 20 Cherokee Ln
- 112 Brooklyn Ave
- 0 Burbank & Erie St
- 155 Sterling St
- 210 Evergreen Dr
- 10368 Wooster Pike
- 5913 Stuckey Rd
- 9791 Hulbert Rd
- 6760 Spruce St
- 0 Easton Rd
- 9376 Daniels Rd
- 5052 Catawba Place Ln
- 5058 Catawba Place Ln
- 63 Center St
- 9389 Towpath Trail
- 5222 Greenwich Rd Unit 30
- 5222 Greenwich Rd Unit 11
- 5222 Greenwich Rd Unit 1
- 5222 Greenwich Rd Unit 28
Your Personal Tour Guide
Ask me questions while you tour the home.