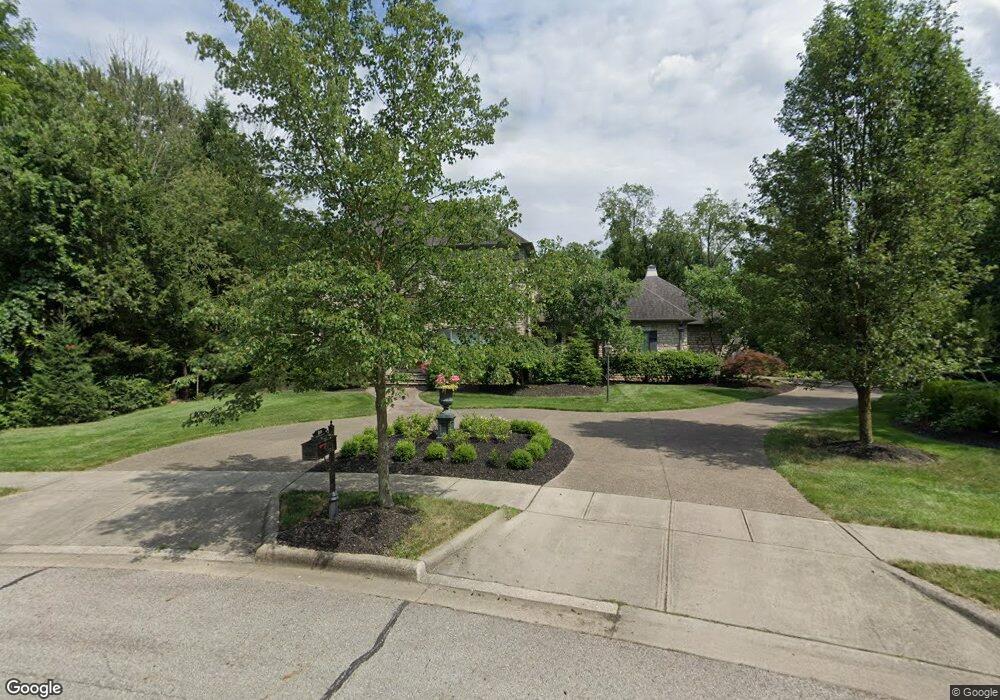
218 Stonegate Cir Columbus, OH 43230
Estimated Value: $874,000 - $1,335,000
4
Beds
6
Baths
4,162
Sq Ft
$279/Sq Ft
Est. Value
About This Home
This home is located at 218 Stonegate Cir, Columbus, OH 43230 and is currently estimated at $1,161,551, approximately $279 per square foot. 218 Stonegate Cir is a home located in Franklin County with nearby schools including Chapelfield Elementary School, Gahanna West Middle School, and Lincoln High School.
Ownership History
Date
Name
Owned For
Owner Type
Purchase Details
Closed on
Dec 4, 2025
Sold by
Grosko Mark L and Grosko Sandra H
Bought by
Grosko Family Trust and Grosko
Current Estimated Value
Purchase Details
Closed on
Aug 12, 2009
Sold by
Vincent General Contractors Inc
Bought by
Grosko Mark L and Grosko Sandra H
Home Financials for this Owner
Home Financials are based on the most recent Mortgage that was taken out on this home.
Original Mortgage
$700,000
Interest Rate
5.28%
Mortgage Type
Future Advance Clause Open End Mortgage
Purchase Details
Closed on
Jul 30, 2007
Sold by
Archer Development Co Llc
Bought by
Vincent General Contractors Inc
Purchase Details
Closed on
Feb 22, 2007
Sold by
Archer Armand F
Bought by
Archer Development Co
Home Financials for this Owner
Home Financials are based on the most recent Mortgage that was taken out on this home.
Original Mortgage
$900,000
Interest Rate
6.23%
Mortgage Type
Construction
Create a Home Valuation Report for This Property
The Home Valuation Report is an in-depth analysis detailing your home's value as well as a comparison with similar homes in the area
Purchase History
| Date | Buyer | Sale Price | Title Company |
|---|---|---|---|
| Grosko Family Trust | -- | None Listed On Document | |
| Grosko Mark L | $173,000 | None Available | |
| Vincent General Contractors Inc | $282,500 | Stewart Tit | |
| Archer Development Co | -- | Independent |
Source: Public Records
Mortgage History
| Date | Status | Borrower | Loan Amount |
|---|---|---|---|
| Previous Owner | Grosko Mark L | $700,000 | |
| Previous Owner | Archer Development Co | $900,000 |
Source: Public Records
Tax History
| Year | Tax Paid | Tax Assessment Tax Assessment Total Assessment is a certain percentage of the fair market value that is determined by local assessors to be the total taxable value of land and additions on the property. | Land | Improvement |
|---|---|---|---|---|
| 2025 | $29,448 | $499,870 | $45,500 | $454,370 |
| 2024 | $29,448 | $499,870 | $45,500 | $454,370 |
| 2023 | $29,078 | $499,870 | $45,500 | $454,370 |
| 2022 | $25,241 | $338,000 | $21,000 | $317,000 |
| 2021 | $24,412 | $338,000 | $21,000 | $317,000 |
| 2020 | $24,208 | $338,000 | $21,000 | $317,000 |
| 2019 | $20,034 | $279,130 | $17,500 | $261,630 |
| 2018 | $9,945 | $279,130 | $17,500 | $261,630 |
| 2017 | $18,387 | $279,130 | $17,500 | $261,630 |
| 2016 | $21,588 | $298,480 | $52,640 | $245,840 |
| 2015 | $10,695 | $295,510 | $52,640 | $242,870 |
| 2014 | $19,989 | $278,290 | $52,640 | $225,650 |
| 2013 | $9,926 | $278,285 | $52,640 | $225,645 |
Source: Public Records
Map
Nearby Homes
- 299 Sherwood Meadows Dr
- 586 Pinegrove Place
- 464 Foxwood Dr
- 292 Moorfield Dr
- 439 Canterwood Ct
- 208 Rugby Ln
- 108 Walcreek Dr W
- 475 Denwood Ct
- 536 Springwood Lake Dr
- 388 Elkwood Place
- 278 Empire Dr
- 302 Zander Ln Unit 302
- 206 Lintner St
- 830 Lindenhaven Rd
- 424 Lincolnshire Rd
- 676 Juniper Ln
- 140 Walnut St
- 956 Crystal Cay Ct
- 427 Canfield Dr
- 365 Sycamore Woods Ln Unit 365
- 200 Stonegate Cir
- 182 Rivers Edge Way
- 222 Stonegate Cir Unit Lot 11
- 184 Rivers Edge Way
- 180 Rivers Edge Way
- 210 Stonegate Cir Unit Lot 14
- 210 Stonegate Cir
- 220 Rivers Edge Way
- 186 Rivers Edge Way
- 228 Stonegate Cir Unit Lot 10
- 178 Rivers Edge Way
- 176 Rivers Edge Way
- 216 Rivers Edge Way
- 222 Rivers Edge Way
- 166 Rivers Edge Way
- 190 Rivers Edge Way
- 170 Rivers Edge Way
- 164 Rivers Edge Way
- 230 Stonegate Cir
- 200 Rivers Edge Way
Your Personal Tour Guide
Ask me questions while you tour the home.