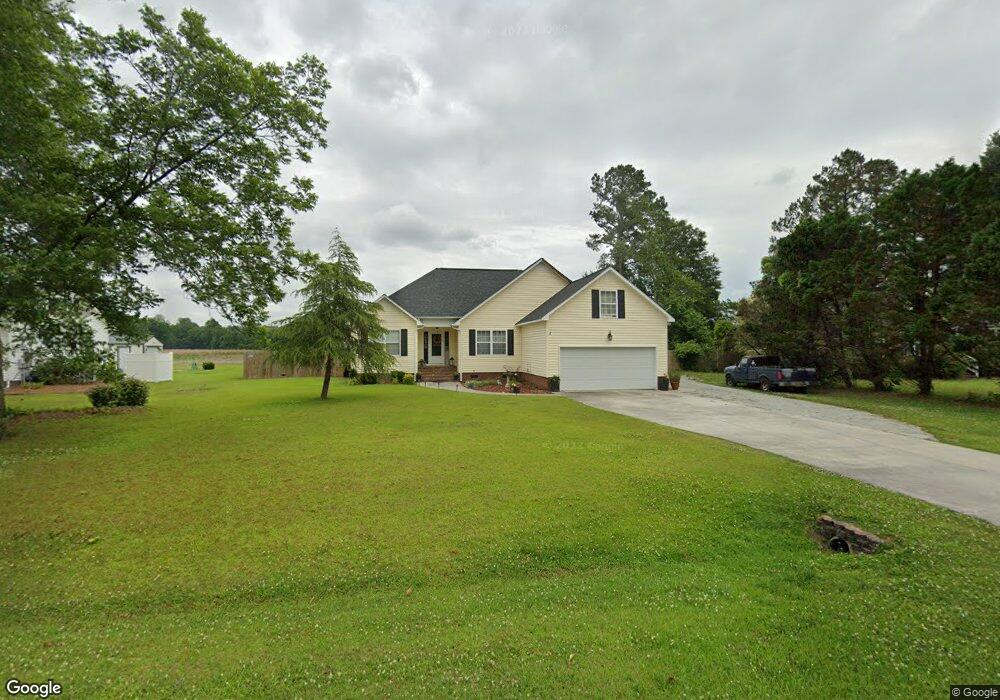
218 Stoney Branch Rd New Bern, NC 28562
Estimated Value: $296,898 - $324,000
3
Beds
2
Baths
1,558
Sq Ft
$202/Sq Ft
Est. Value
About This Home
This home is located at 218 Stoney Branch Rd, New Bern, NC 28562 and is currently estimated at $313,975, approximately $201 per square foot. 218 Stoney Branch Rd is a home located in Craven County with nearby schools including James W. Smith Elementary School, West Craven Middle School, and West Craven High School.
Ownership History
Date
Name
Owned For
Owner Type
Purchase Details
Closed on
Nov 14, 2019
Sold by
Gray Amber
Bought by
Brannon John C and Brannon Deborah F
Current Estimated Value
Home Financials for this Owner
Home Financials are based on the most recent Mortgage that was taken out on this home.
Original Mortgage
$179,000
Outstanding Balance
$157,474
Interest Rate
3.6%
Mortgage Type
VA
Estimated Equity
$156,501
Purchase Details
Closed on
May 4, 2018
Sold by
Conoer Crystal A and King Maurice E
Bought by
Gray Amber
Home Financials for this Owner
Home Financials are based on the most recent Mortgage that was taken out on this home.
Original Mortgage
$154,000
Interest Rate
4.8%
Mortgage Type
Adjustable Rate Mortgage/ARM
Purchase Details
Closed on
Jul 7, 2016
Sold by
Richard C Gallagher
Bought by
Conover Crystal and King Maurice
Home Financials for this Owner
Home Financials are based on the most recent Mortgage that was taken out on this home.
Original Mortgage
$159,000
Interest Rate
3.41%
Create a Home Valuation Report for This Property
The Home Valuation Report is an in-depth analysis detailing your home's value as well as a comparison with similar homes in the area
Home Values in the Area
Average Home Value in this Area
Purchase History
| Date | Buyer | Sale Price | Title Company |
|---|---|---|---|
| Brannon John C | $179,000 | -- | |
| Gray Amber | $162,000 | -- | |
| Conover Crystal | -- | -- |
Source: Public Records
Mortgage History
| Date | Status | Borrower | Loan Amount |
|---|---|---|---|
| Open | Brannon John C | $179,000 | |
| Previous Owner | Gray Amber | $154,000 | |
| Previous Owner | Conover Crystal | $159,000 | |
| Previous Owner | Conover Crystal | -- |
Source: Public Records
Tax History Compared to Growth
Tax History
| Year | Tax Paid | Tax Assessment Tax Assessment Total Assessment is a certain percentage of the fair market value that is determined by local assessors to be the total taxable value of land and additions on the property. | Land | Improvement |
|---|---|---|---|---|
| 2025 | $921 | $227,850 | $30,000 | $197,850 |
| 2024 | $921 | $227,850 | $30,000 | $197,850 |
| 2023 | $921 | $227,850 | $30,000 | $197,850 |
| 2022 | $817 | $171,990 | $25,500 | $146,490 |
| 2021 | $817 | $171,990 | $25,500 | $146,490 |
| 2020 | $822 | $171,990 | $25,500 | $146,490 |
| 2019 | $1,133 | $171,990 | $25,500 | $146,490 |
| 2018 | $1,092 | $171,990 | $25,500 | $146,490 |
| 2017 | $1,092 | $171,990 | $25,500 | $146,490 |
| 2016 | $1,092 | $183,200 | $25,500 | $157,700 |
| 2015 | $1,017 | $183,200 | $25,500 | $157,700 |
| 2014 | $1,017 | $183,200 | $25,500 | $157,700 |
Source: Public Records
Map
Nearby Homes
- 211 Stony Branch Rd
- 102 Spring Ridge Ct
- 655 van Moreadith Rd
- 4135 River Rd
- 165 High School Rd
- 5570 River
- 104 Hollie Field Ln
- 155 Webster Ln
- 6320 River
- 137 Webster Ln
- 1450 State Camp Rd
- 6494 River Rd
- 117 Trellis Ln
- 112 Trellis Ln
- 113 Trellis Ln
- 780 Campbell Rd
- 370 Willis Neck Rd
- 100 Abbey
- 0 Parker
- 435 Sanders Ln
- 218 Stony Branch Rd
- 216 Stoney Branch Rd
- 220 Stony Branch Rd
- 209 Stony Branch Rd
- 222 Stony Branch Rd
- 209 Stony Branch Rd
- 214 Stony Branch Rd
- 101 Kit Ct
- 224 Stony Branch Rd
- 212 Stoney Branch Rd
- 103 Kit Ct
- 104 Kit Ct
- 106 Kit Ct
- 226 Stony Branch Rd
- 210 Stony Branch Rd
- 213 Stony Branch Rd
- 213 Stony Branch Rd
- 210 Stony Branch Rd
- 105 Kit Ct
- 215 Stony Branch Rd