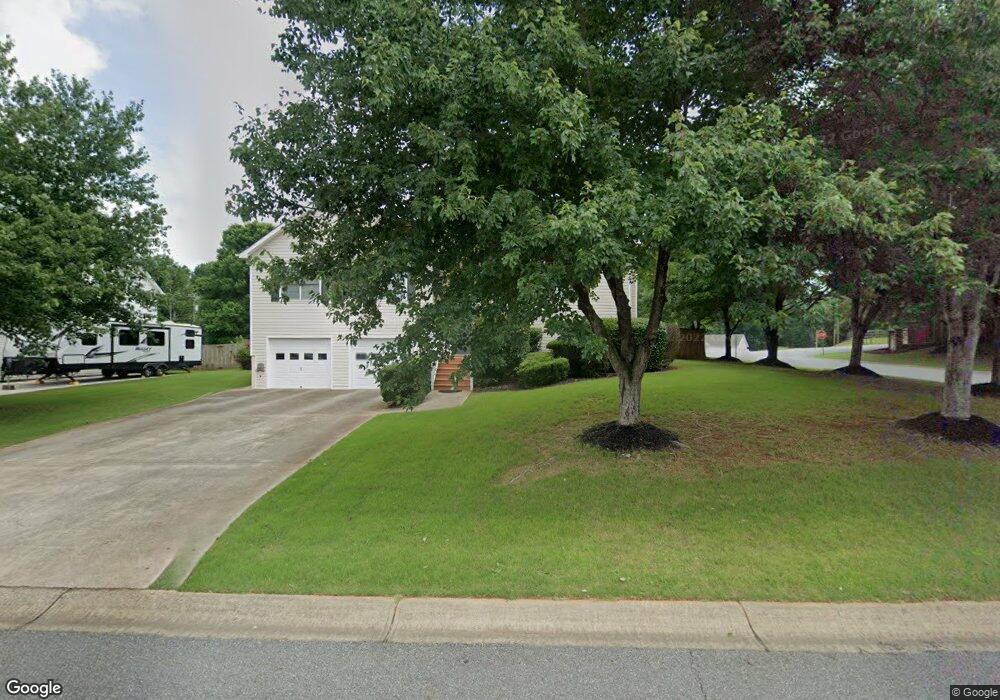
218 Taylors Farm Dr Unit 1 Canton, GA 30115
Estimated Value: $408,492 - $441,000
4
Beds
3
Baths
2,571
Sq Ft
$165/Sq Ft
Est. Value
About This Home
This home is located at 218 Taylors Farm Dr Unit 1, Canton, GA 30115 and is currently estimated at $424,746, approximately $165 per square foot. 218 Taylors Farm Dr Unit 1 is a home located in Cherokee County with nearby schools including Indian Knoll Elementary School, Rusk Middle School, and Sequoyah High School.
Ownership History
Date
Name
Owned For
Owner Type
Purchase Details
Closed on
Sep 15, 2017
Sold by
Burkhalter Eric H
Bought by
Ferreira Michelle and Ferreira Antonio
Current Estimated Value
Home Financials for this Owner
Home Financials are based on the most recent Mortgage that was taken out on this home.
Original Mortgage
$219,220
Outstanding Balance
$182,576
Interest Rate
3.89%
Mortgage Type
New Conventional
Estimated Equity
$242,170
Purchase Details
Closed on
Mar 7, 2016
Sold by
Grizzard Kevin M
Bought by
Burkhalter Eric H
Home Financials for this Owner
Home Financials are based on the most recent Mortgage that was taken out on this home.
Original Mortgage
$192,449
Interest Rate
3.75%
Mortgage Type
FHA
Purchase Details
Closed on
Sep 18, 2001
Sold by
Turman Properties Inc
Bought by
Grizzard Kevin M and Grizzard Sandra W
Home Financials for this Owner
Home Financials are based on the most recent Mortgage that was taken out on this home.
Original Mortgage
$150,750
Interest Rate
6.89%
Mortgage Type
FHA
Create a Home Valuation Report for This Property
The Home Valuation Report is an in-depth analysis detailing your home's value as well as a comparison with similar homes in the area
Home Values in the Area
Average Home Value in this Area
Purchase History
| Date | Buyer | Sale Price | Title Company |
|---|---|---|---|
| Ferreira Michelle | $226,000 | -- | |
| Burkhalter Eric H | $196,000 | -- | |
| Grizzard Kevin M | $153,200 | -- |
Source: Public Records
Mortgage History
| Date | Status | Borrower | Loan Amount |
|---|---|---|---|
| Open | Ferreira Michelle | $219,220 | |
| Previous Owner | Burkhalter Eric H | $192,449 | |
| Previous Owner | Grizzard Kevin M | $150,750 |
Source: Public Records
Tax History Compared to Growth
Tax History
| Year | Tax Paid | Tax Assessment Tax Assessment Total Assessment is a certain percentage of the fair market value that is determined by local assessors to be the total taxable value of land and additions on the property. | Land | Improvement |
|---|---|---|---|---|
| 2025 | $6,465 | $146,716 | $34,000 | $112,716 |
| 2024 | $3,483 | $136,360 | $24,000 | $112,360 |
| 2023 | $3,129 | $138,280 | $24,000 | $114,280 |
| 2022 | $3,022 | $110,680 | $24,000 | $86,680 |
| 2021 | $2,511 | $109,400 | $19,600 | $89,800 |
| 2020 | $2,975 | $97,200 | $17,200 | $80,000 |
| 2019 | $2,177 | $92,400 | $16,400 | $76,000 |
| 2018 | $2,664 | $83,600 | $16,400 | $67,200 |
| 2017 | $2,283 | $178,500 | $15,600 | $55,800 |
| 2016 | $1,607 | $162,600 | $14,400 | $50,640 |
| 2015 | $1,489 | $149,900 | $12,800 | $47,160 |
| 2014 | $1,443 | $145,100 | $14,400 | $43,640 |
Source: Public Records
Map
Nearby Homes
- 137 Cypress Ct
- 134 Cypress Ct
- 121 Cypress Ct
- 438 Mountainview Cir
- 107 Cypress Ct
- n/a Hembredge Dr
- 223 Johnson Dr
- Sherwood Plan at The Reserve at Knollwood
- Abney Plan at The Reserve at Knollwood
- Chatfield Plan at The Reserve at Knollwood
- Presley Plan at The Reserve at Knollwood
- 232 Barrett Springs Way
- 0 Hembredge Dr Unit 7288224
- 590 Arthur Rd
- 226 Cedar Valley Ct
- 313 Sassafras Way
- 158 Redbud Rd
- 162 Redbud Rd
- 166 Redbud Rd
- 218 Taylors Farm Dr
- 220 Taylors Farm Dr
- 216 Taylors Farm Dr
- 222 Taylors Farm Dr
- 215 Taylors Farm Dr
- 217 Taylors Farm Dr
- 213 Taylors Farm Dr
- 219 Taylors Farm Dr
- 214 Taylors Farm Dr
- 224 Taylors Farm Dr
- 211 Taylors Farm Dr
- 221 Taylors Farm Dr
- 859 Pinecrest Rd
- 209 Taylors Farm Dr
- 212 Taylors Farm Dr
- 605 Spring Mill Ct
- 0 Spring Mill Ct Unit 7438951
- 0 Spring Mill Ct
- 226 Taylors Farm Dr
- 404 Cross Tie Ct