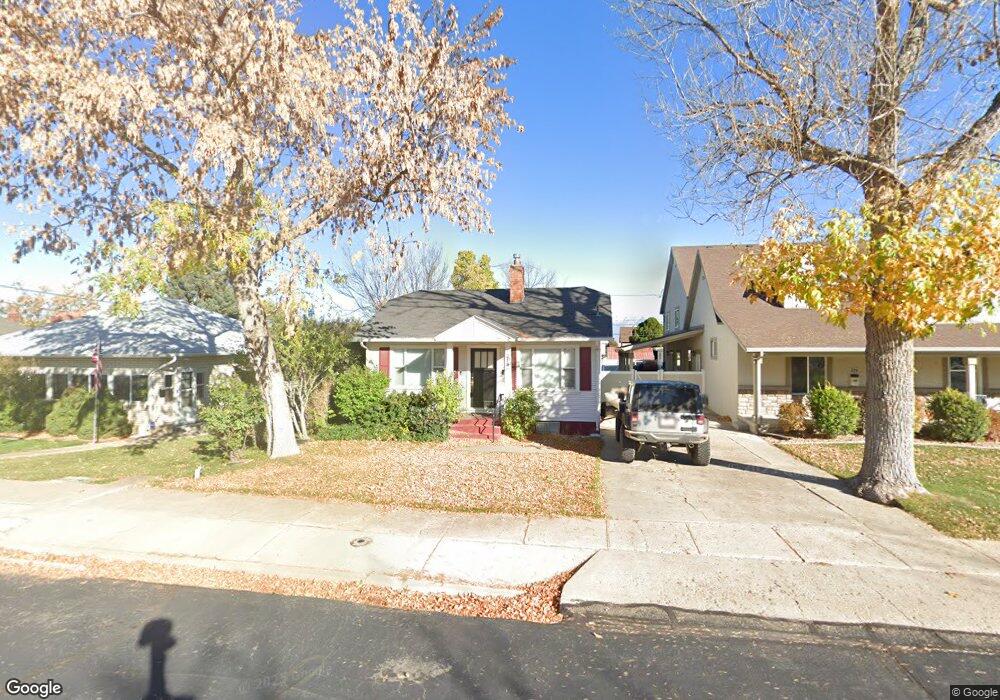
218 W 300 N Spanish Fork, UT 84660
Estimated Value: $284,000 - $393,000
3
Beds
2
Baths
1,250
Sq Ft
$268/Sq Ft
Est. Value
About This Home
This home is located at 218 W 300 N, Spanish Fork, UT 84660 and is currently estimated at $334,504, approximately $267 per square foot. 218 W 300 N is a home located in Utah County with nearby schools including Brockbank Elementary School, Spanish Fork Jr High School, and Spanish Fork High School.
Ownership History
Date
Name
Owned For
Owner Type
Purchase Details
Closed on
Apr 20, 2021
Sold by
Neel Adam
Bought by
Neel Adam
Current Estimated Value
Home Financials for this Owner
Home Financials are based on the most recent Mortgage that was taken out on this home.
Original Mortgage
$229,633
Outstanding Balance
$207,497
Interest Rate
3.05%
Mortgage Type
FHA
Estimated Equity
$127,007
Purchase Details
Closed on
Feb 27, 2020
Sold by
Leifson Steven M and Leifson Cheryl K
Bought by
Neel Adam
Home Financials for this Owner
Home Financials are based on the most recent Mortgage that was taken out on this home.
Original Mortgage
$224,000
Interest Rate
3.6%
Mortgage Type
Unknown
Create a Home Valuation Report for This Property
The Home Valuation Report is an in-depth analysis detailing your home's value as well as a comparison with similar homes in the area
Home Values in the Area
Average Home Value in this Area
Purchase History
| Date | Buyer | Sale Price | Title Company |
|---|---|---|---|
| Neel Adam | -- | Vanguard Title Insurance Age | |
| Neel Adam | -- | Stewart Title Ins Agcy Of Ut |
Source: Public Records
Mortgage History
| Date | Status | Borrower | Loan Amount |
|---|---|---|---|
| Open | Neel Adam | $229,633 | |
| Closed | Neel Adam | $224,000 |
Source: Public Records
Tax History Compared to Growth
Tax History
| Year | Tax Paid | Tax Assessment Tax Assessment Total Assessment is a certain percentage of the fair market value that is determined by local assessors to be the total taxable value of land and additions on the property. | Land | Improvement |
|---|---|---|---|---|
| 2025 | $1,287 | $149,270 | $107,400 | $164,000 |
| 2024 | $1,287 | $132,605 | $0 | $0 |
| 2023 | $1,329 | $137,170 | $0 | $0 |
| 2022 | $1,462 | $147,950 | $0 | $0 |
| 2021 | $1,268 | $205,300 | $62,300 | $143,000 |
| 2020 | $1,146 | $180,700 | $51,900 | $128,800 |
| 2019 | $990 | $163,900 | $51,900 | $112,000 |
| 2018 | $933 | $149,300 | $51,900 | $97,400 |
| 2017 | $846 | $72,765 | $0 | $0 |
| 2016 | $698 | $59,235 | $0 | $0 |
| 2015 | $639 | $53,625 | $0 | $0 |
| 2014 | $644 | $54,230 | $0 | $0 |
Source: Public Records
Map
Nearby Homes