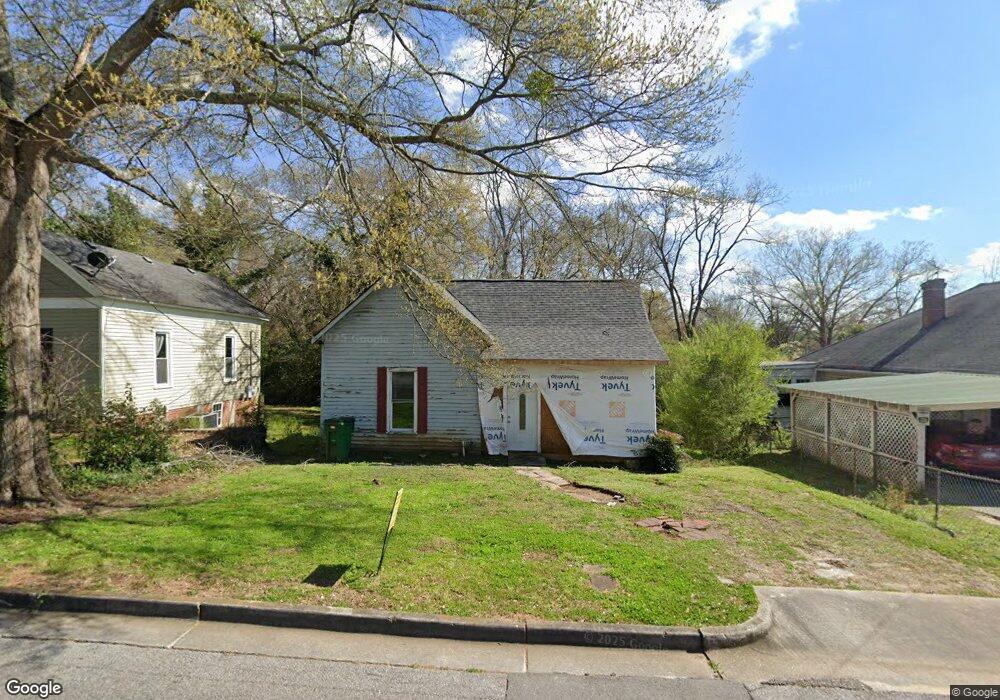
218 W Chandler St Carrollton, GA 30117
Estimated Value: $159,000 - $237,000
2
Beds
2
Baths
1,200
Sq Ft
$164/Sq Ft
Est. Value
About This Home
This home is located at 218 W Chandler St, Carrollton, GA 30117 and is currently estimated at $197,196, approximately $164 per square foot. 218 W Chandler St is a home located in Carroll County with nearby schools including Carrollton Elementary School, Carrollton Upper Elementary School, and Carrollton Middle School.
Ownership History
Date
Name
Owned For
Owner Type
Purchase Details
Closed on
Nov 30, 2018
Sold by
Vergara Sergio A
Bought by
Higher Ground Properties Llc
Current Estimated Value
Purchase Details
Closed on
Mar 17, 2017
Sold by
Sergio H Estate
Bought by
Vergara Rosa B and Vergara Mirtha R
Purchase Details
Closed on
Apr 20, 1992
Sold by
Vergara Sergio Alberto Etal
Bought by
Valenzuela Rosa Berta Etal
Purchase Details
Closed on
Jun 1, 1986
Sold by
Rivera Roberto and Rivera Orlando
Bought by
Vergara Sergio Alberto Etal
Purchase Details
Closed on
May 1, 1986
Sold by
Wallis David S and Blair Foster G
Bought by
Rivera Roberto and Rivera Orlando
Purchase Details
Closed on
May 1, 1977
Sold by
Ann Duke W and Ann Hendrix
Bought by
Wallis David S and Blair Foster G
Purchase Details
Closed on
Feb 1, 1972
Bought by
Ann Duke W and Ann Hendrix
Create a Home Valuation Report for This Property
The Home Valuation Report is an in-depth analysis detailing your home's value as well as a comparison with similar homes in the area
Home Values in the Area
Average Home Value in this Area
Purchase History
| Date | Buyer | Sale Price | Title Company |
|---|---|---|---|
| Higher Ground Properties Llc | $60,000 | -- | |
| Vergara Rosa B | -- | -- | |
| Valenzuela Rosa Berta Etal | -- | -- | |
| Vergara Sergio Alberto Etal | $22,500 | -- | |
| Rivera Roberto | $18,500 | -- | |
| Wallis David S | -- | -- | |
| Ann Duke W | -- | -- |
Source: Public Records
Tax History Compared to Growth
Tax History
| Year | Tax Paid | Tax Assessment Tax Assessment Total Assessment is a certain percentage of the fair market value that is determined by local assessors to be the total taxable value of land and additions on the property. | Land | Improvement |
|---|---|---|---|---|
| 2024 | $1,201 | $43,966 | $13,190 | $30,776 |
| 2023 | $1,201 | $41,203 | $13,190 | $28,013 |
| 2022 | $860 | $29,470 | $8,794 | $20,676 |
| 2021 | $707 | $24,222 | $6,504 | $17,718 |
| 2020 | $657 | $22,494 | $6,504 | $15,990 |
| 2019 | $343 | $11,640 | $6,504 | $5,136 |
| 2018 | $322 | $19,644 | $6,504 | $13,140 |
| 2017 | $105 | $19,644 | $6,504 | $13,140 |
| 2016 | $106 | $19,644 | $6,504 | $13,140 |
| 2015 | $78 | $13,452 | $4,656 | $8,797 |
| 2014 | $78 | $13,453 | $4,656 | $8,797 |
Source: Public Records
Map
Nearby Homes
- 103 W Chandler St
- 405 N Park St
- 108 Springwood Dr
- 110 Town Walk Ln
- 654 King St
- TRACT1-7 Us Highway 27
- 0 Ward St Unit 10390499
- 205 Johnson Ave Unit 231
- 777 College St
- 541 N White St Unit 12
- 541 N White St
- 109 S Park St
- 250 Riversong Rd
- 250 Riversong Rd Unit 55
- 301 C4 Bradley St
- 301 Bradley St
- 160 Watson St
- 109 7th St
- 322 Cedar St
- 123 Cedar Park Way
- 214 W Chandler St
- 222 W Chandler St
- W W Chandler St
- 245 W Chandler St
- 208 W Chandler St
- 215 W Chandler St
- 219 W Chandler St
- 219 Spring St
- 219 Spring St
- 209 Spring St
- 202 W Chandler St
- 215 Spring St
- 205 Spring St
- 102 Wrenwood Ln
- 104 Wrenwood Ln
- 107 Wrenwood Ln
- 106 Wrenwood Ln
- 615 N Cliff St
- 201 Spring St
- 108 Wrenwood Ln