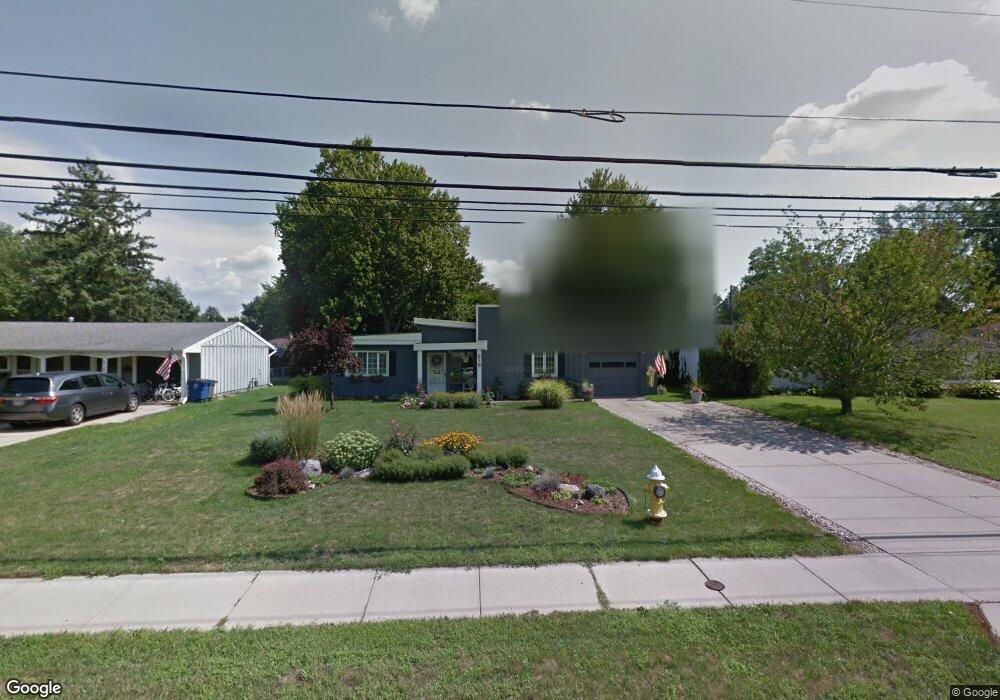
218 W South Boundary St Perrysburg, OH 43551
Estimated Value: $254,000 - $270,000
3
Beds
1
Bath
1,656
Sq Ft
$159/Sq Ft
Est. Value
About This Home
This home is located at 218 W South Boundary St, Perrysburg, OH 43551 and is currently estimated at $263,845, approximately $159 per square foot. 218 W South Boundary St is a home located in Wood County with nearby schools including Frank Elementary School, Perrysburg Junior High School, and Perrysburg High School.
Ownership History
Date
Name
Owned For
Owner Type
Purchase Details
Closed on
Mar 25, 2005
Sold by
Lentz Terry D
Bought by
Lentz Terry D and Lentz Kenda M
Current Estimated Value
Home Financials for this Owner
Home Financials are based on the most recent Mortgage that was taken out on this home.
Original Mortgage
$174,400
Outstanding Balance
$89,001
Interest Rate
5.71%
Mortgage Type
New Conventional
Estimated Equity
$174,844
Purchase Details
Closed on
Jun 7, 2001
Sold by
Sandwisch Michelle L
Bought by
Lentz Terry D
Home Financials for this Owner
Home Financials are based on the most recent Mortgage that was taken out on this home.
Original Mortgage
$117,935
Interest Rate
7.18%
Mortgage Type
VA
Purchase Details
Closed on
Sep 28, 1998
Sold by
Popiolek Richard S and Popiolek Jeanne C
Bought by
Sandwisch Michelle L
Purchase Details
Closed on
Mar 16, 1989
Bought by
Popiolek Richard S
Create a Home Valuation Report for This Property
The Home Valuation Report is an in-depth analysis detailing your home's value as well as a comparison with similar homes in the area
Home Values in the Area
Average Home Value in this Area
Purchase History
| Date | Buyer | Sale Price | Title Company |
|---|---|---|---|
| Lentz Terry D | -- | Federated Land Title Agency | |
| Lentz Terry D | $114,500 | Louisville Title Agency For | |
| Sandwisch Michelle L | $108,000 | -- | |
| Popiolek Richard S | $70,000 | -- |
Source: Public Records
Mortgage History
| Date | Status | Borrower | Loan Amount |
|---|---|---|---|
| Open | Lentz Terry D | $174,400 | |
| Closed | Lentz Terry D | $117,935 | |
| Closed | Lentz Terry D | $32,700 |
Source: Public Records
Tax History Compared to Growth
Tax History
| Year | Tax Paid | Tax Assessment Tax Assessment Total Assessment is a certain percentage of the fair market value that is determined by local assessors to be the total taxable value of land and additions on the property. | Land | Improvement |
|---|---|---|---|---|
| 2024 | $4,364 | $75,215 | $15,785 | $59,430 |
| 2023 | $4,364 | $75,220 | $15,790 | $59,430 |
| 2021 | $3,717 | $58,950 | $13,830 | $45,120 |
| 2020 | $3,696 | $58,950 | $13,830 | $45,120 |
| 2019 | $3,323 | $51,420 | $13,830 | $37,590 |
| 2018 | $2,951 | $51,420 | $13,830 | $37,590 |
| 2017 | $2,932 | $51,420 | $13,830 | $37,590 |
| 2016 | $2,732 | $45,820 | $13,830 | $31,990 |
| 2015 | $2,732 | $45,820 | $13,830 | $31,990 |
| 2014 | $2,755 | $45,820 | $13,830 | $31,990 |
| 2013 | $2,819 | $45,820 | $13,830 | $31,990 |
Source: Public Records
Map
Nearby Homes
- 1016 Walnut St
- 412 W South Boundary St
- 1085 Birch Dr
- 135 Birchcrest Dr
- 333 Southwood Dr
- 872 Cherry St
- 865 Mulberry St
- 11966 Eckel Junction Rd
- 170 Edgewood Dr
- 204 W 8th St
- 622 Turnbury Ln Unit 622
- 1031 Maple St
- 832 Turnbury Ln Unit 28
- 251 Mallard Rd
- 277 Blue Jacket Rd
- 122 W 6th St
- 26395 Carronade Dr
- 11037 Bay Trace Dr
- 525 Orchard St
- 14 Hawthorne Crossing
- 212 W South Boundary St
- 224 W South Boundary St
- 230 W South Boundary St
- 206 W South Boundary St
- 225 Margaret Place
- 221 Margaret Place
- 231 Margaret Place
- 225 W South Boundary St
- 200 W South Boundary St
- 236 W South Boundary St
- 237 Margaret Place
- 231 W South Boundary St
- 237 W South Boundary St
- 217 Margaret Place
- 243 Margaret Place
- 219 W South Boundary St
- 249 W South Boundary St
- 213 Margaret Place
- 213 W South Boundary St