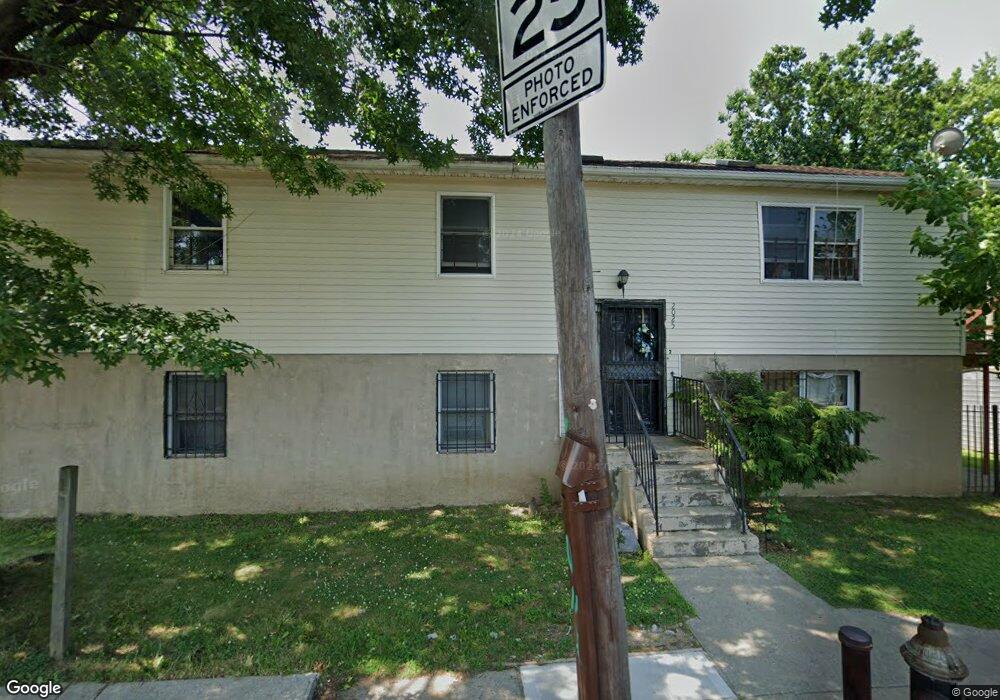
2180-2198 de Reimer Ave Bronx, NY 10475
Co-op City NeighborhoodEstimated Value: $765,305 - $963,000
--
Bed
--
Bath
2,200
Sq Ft
$394/Sq Ft
Est. Value
About This Home
This home is located at 2180-2198 de Reimer Ave, Bronx, NY 10475 and is currently estimated at $867,076, approximately $394 per square foot. 2180-2198 de Reimer Ave is a home located in Bronx County with nearby schools including P.S. 160 - Walt Disney, M.S. 180 - Dr. Daniel Hale Williams, and Harry S. Truman High School.
Ownership History
Date
Name
Owned For
Owner Type
Purchase Details
Closed on
Mar 6, 2018
Sold by
Scott Diane A
Bought by
Smith Tasha
Current Estimated Value
Home Financials for this Owner
Home Financials are based on the most recent Mortgage that was taken out on this home.
Original Mortgage
$515,490
Outstanding Balance
$440,047
Interest Rate
4.22%
Mortgage Type
New Conventional
Estimated Equity
$427,029
Purchase Details
Closed on
Nov 25, 2016
Sold by
Scott Diane A
Bought by
Scott Diane A and Scott Fred
Home Financials for this Owner
Home Financials are based on the most recent Mortgage that was taken out on this home.
Original Mortgage
$216,000
Interest Rate
4.13%
Mortgage Type
New Conventional
Purchase Details
Closed on
Nov 14, 1997
Sold by
Scott A Diane C
Bought by
Scott A Diane C
Create a Home Valuation Report for This Property
The Home Valuation Report is an in-depth analysis detailing your home's value as well as a comparison with similar homes in the area
Home Values in the Area
Average Home Value in this Area
Purchase History
| Date | Buyer | Sale Price | Title Company |
|---|---|---|---|
| Smith Tasha | $525,000 | -- | |
| Smith Tasha | $525,000 | -- | |
| Scott Diane A | -- | -- | |
| Scott Diane A | -- | -- | |
| Scott A Diane C | -- | Commonwealth Land Title Ins | |
| Scott A Diane C | -- | Commonwealth Land Title Ins |
Source: Public Records
Mortgage History
| Date | Status | Borrower | Loan Amount |
|---|---|---|---|
| Open | Smith Tasha | $515,490 | |
| Closed | Smith Tasha | $515,490 | |
| Previous Owner | Scott Diane A | $216,000 |
Source: Public Records
Tax History Compared to Growth
Tax History
| Year | Tax Paid | Tax Assessment Tax Assessment Total Assessment is a certain percentage of the fair market value that is determined by local assessors to be the total taxable value of land and additions on the property. | Land | Improvement |
|---|---|---|---|---|
| 2025 | $6,683 | $35,272 | $5,023 | $30,249 |
| 2024 | $6,683 | $33,275 | $4,942 | $28,333 |
| 2023 | $6,375 | $31,392 | $5,392 | $26,000 |
| 2022 | $6,267 | $40,200 | $8,100 | $32,100 |
| 2021 | $6,557 | $37,860 | $8,100 | $29,760 |
| 2020 | $6,222 | $40,500 | $8,100 | $32,400 |
| 2019 | $5,801 | $36,660 | $8,100 | $28,560 |
| 2018 | $5,333 | $26,160 | $8,100 | $18,060 |
| 2017 | $5,840 | $28,651 | $7,584 | $21,067 |
| 2016 | $5,404 | $27,030 | $7,618 | $19,412 |
| 2015 | $3,274 | $25,500 | $9,000 | $16,500 |
| 2014 | $3,274 | $25,500 | $9,000 | $16,500 |
Source: Public Records
Map
Nearby Homes
- 2201 Palmer Ave
- 2211 de Reimer Ave
- 2225 Boller Ave
- 2227 Boller Ave
- 2211 Hunter Ave
- 1910 Pelham Pkwy S Unit 5C
- 1874 Pelham Pkwy S Unit 6M
- 1874 Pelham Pkwy S Unit 5B
- 1874 Pelham Pkwy S Unit 6E
- 1874 Pelham Pkwy S Unit 4R
- 2015 Saint Paul Ave Unit 3H
- 2015 St Paul Ave Unit 3G
- 2015 Saint Paul Ave Unit 6B
- 2024 Continental Ave
- 2032 Hobart Ave
- 2887 E 194th St
- 2871 E 194th St
- 2010 Hobart Ave
- 2344 Tiemann Ave
- 2330 Kingsland Ave
- 2180 de Reimer Ave Unit 2198
- 2190 de Reimer Ave
- 2190 de Reimer Ave Unit 1
- 2208 de Reimer Ave Unit 2
- 2208 de Reimer Ave
- 2035 Erskine Place
- 2195 Palmer Ave
- 2205 Palmer Ave
- 2210 de Reimer Ave
- 2209 Palmer Ave
- 2212 de Reimer Ave
- 2209 de Reimer Ave
- 2211 Palmer Ave
- 2211 de Reimer Ave Unit 2
- 2198 Palmer Ave
- 2200 Palmer Ave
- 2024 Stillwell Ave
- 2202 Palmer Ave
- 2215 Palmer Ave
- 2215 Palmer Ave Unit 1