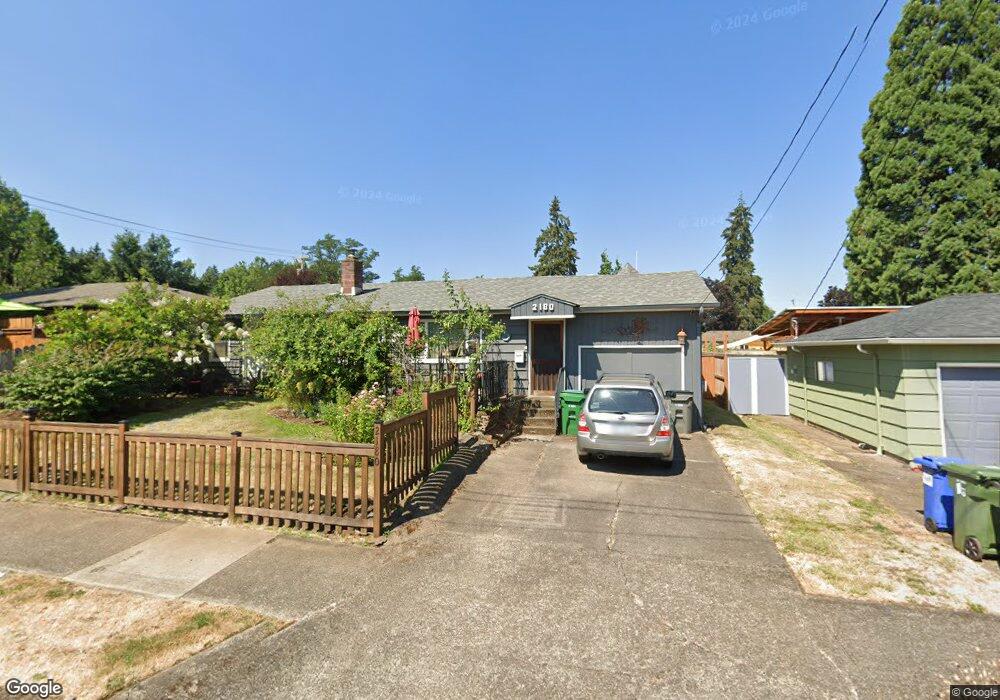
2180 Hayes St Eugene, OR 97405
Far West NeighborhoodEstimated Value: $373,000 - $403,000
3
Beds
1
Bath
1,112
Sq Ft
$348/Sq Ft
Est. Value
About This Home
This home is located at 2180 Hayes St, Eugene, OR 97405 and is currently estimated at $386,467, approximately $347 per square foot. 2180 Hayes St is a home located in Lane County with nearby schools including Cesar Chavez Elementary School, Arts And Technology Academy At Jefferson, and Churchill High School.
Ownership History
Date
Name
Owned For
Owner Type
Purchase Details
Closed on
Aug 19, 2005
Sold by
Vanett Debra L
Bought by
Drake Diana L
Current Estimated Value
Home Financials for this Owner
Home Financials are based on the most recent Mortgage that was taken out on this home.
Original Mortgage
$87,500
Outstanding Balance
$45,381
Interest Rate
5.56%
Mortgage Type
Fannie Mae Freddie Mac
Estimated Equity
$341,086
Purchase Details
Closed on
Nov 28, 2001
Sold by
Hebert Russ A and Hebert Victoria L
Bought by
Vanett Debra L
Home Financials for this Owner
Home Financials are based on the most recent Mortgage that was taken out on this home.
Original Mortgage
$123,576
Interest Rate
6.67%
Mortgage Type
FHA
Purchase Details
Closed on
Apr 9, 1999
Sold by
Longnight Robin G
Bought by
Hebert Russ A and Hebert Victoria L
Home Financials for this Owner
Home Financials are based on the most recent Mortgage that was taken out on this home.
Original Mortgage
$110,829
Interest Rate
7.04%
Mortgage Type
FHA
Create a Home Valuation Report for This Property
The Home Valuation Report is an in-depth analysis detailing your home's value as well as a comparison with similar homes in the area
Home Values in the Area
Average Home Value in this Area
Purchase History
| Date | Buyer | Sale Price | Title Company |
|---|---|---|---|
| Drake Diana L | $175,000 | First American Title | |
| Vanett Debra L | $124,900 | Western Title & Escrow Compa | |
| Hebert Russ A | $111,000 | Title Guaranty Company |
Source: Public Records
Mortgage History
| Date | Status | Borrower | Loan Amount |
|---|---|---|---|
| Open | Drake Diana L | $87,500 | |
| Previous Owner | Vanett Debra L | $123,576 | |
| Previous Owner | Hebert Russ A | $110,829 |
Source: Public Records
Tax History
| Year | Tax Paid | Tax Assessment Tax Assessment Total Assessment is a certain percentage of the fair market value that is determined by local assessors to be the total taxable value of land and additions on the property. | Land | Improvement |
|---|---|---|---|---|
| 2025 | $3,502 | $179,718 | -- | -- |
| 2024 | $3,458 | $174,484 | -- | -- |
| 2023 | $3,458 | $169,402 | $0 | $0 |
| 2022 | $3,240 | $164,468 | $0 | $0 |
| 2021 | $3,043 | $159,678 | $0 | $0 |
| 2020 | $3,054 | $155,028 | $0 | $0 |
| 2019 | $2,949 | $150,513 | $0 | $0 |
| 2018 | $2,776 | $141,874 | $0 | $0 |
| 2017 | $2,652 | $141,874 | $0 | $0 |
| 2016 | $2,586 | $137,742 | $0 | $0 |
| 2015 | $2,512 | $133,730 | $0 | $0 |
| 2014 | $2,461 | $129,835 | $0 | $0 |
Source: Public Records
Map
Nearby Homes
- 2096 1/2 Arthur St
- 1955 Arthur St
- 2230 Cleveland St
- 2260 Orr Ln
- 2279 City View St
- 1910 W 17th Ave
- 2064 W 17th Ave
- 1943 W 17th Ave Unit A
- 1735 Cleveland Place
- 2070 W 16th Way
- 1674 Hayes St Unit B
- 1935 W 17th Ave Unit B
- 2037 Morning View Dr
- 1890 Taylor St
- 1579 Garfield Place Unit 1579
- 2095 Polk St
- 2430 Wilson Dr
- 2673 Garfield St
- 2161 W 16th Ave
- 2225 W 28th Ave
- 2190 Hayes St
- 2160 Hayes St
- 1955 W 22nd Ave
- 2150 Hayes St
- 2175 Garfield St
- 2175 Hayes St
- 2195 Garfield St
- 1885 W 22nd Ave
- 2165 Garfield St
- 1910 W 22nd Ave
- 2165 Hayes St
- 2140 Hayes St
- 2145 Garfield St
- 2145 Hayes St
- 2205 Garfield St
- 2130 Hayes St
- 1880 W 22nd Ave
- 2115 Garfield St
- 2135 Hayes St
- 2225 Garfield St
Your Personal Tour Guide
Ask me questions while you tour the home.