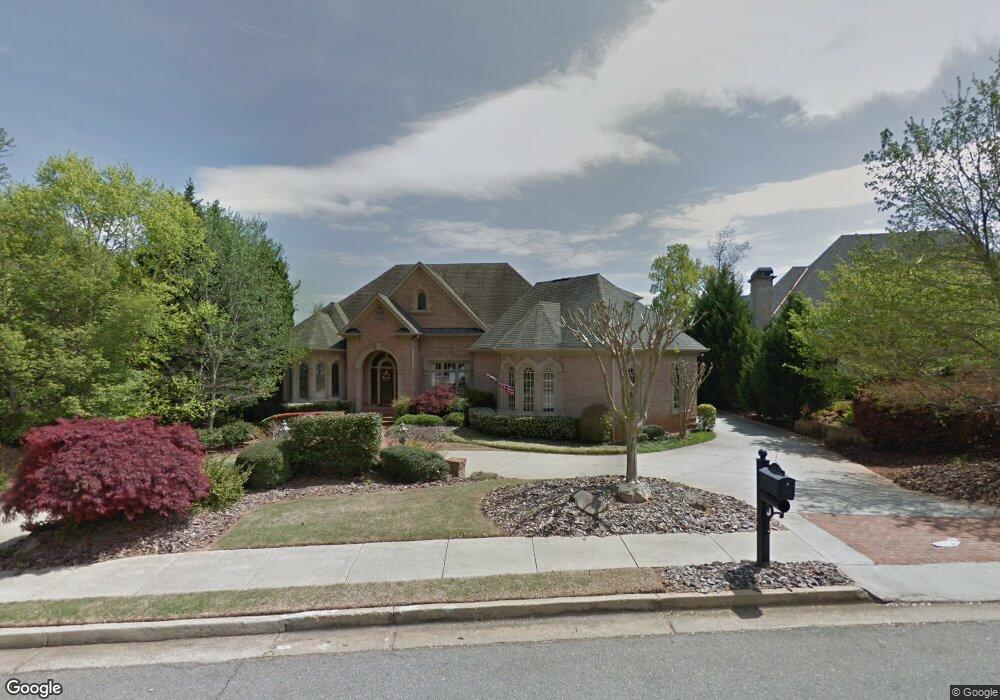
2180 Lake Shore Landing Alpharetta, GA 30005
Windward NeighborhoodEstimated Value: $1,559,863 - $2,309,000
4
Beds
4
Baths
5,303
Sq Ft
$366/Sq Ft
Est. Value
About This Home
This home is located at 2180 Lake Shore Landing, Alpharetta, GA 30005 and is currently estimated at $1,940,716, approximately $365 per square foot. 2180 Lake Shore Landing is a home located in Fulton County with nearby schools including Creek View Elementary School, Webb Bridge Middle School, and Alpharetta High School.
Ownership History
Date
Name
Owned For
Owner Type
Purchase Details
Closed on
Apr 10, 2017
Sold by
Kennedy Clifford Todd /Tr
Bought by
Johnson Craig N and Johnson Melinda L
Current Estimated Value
Home Financials for this Owner
Home Financials are based on the most recent Mortgage that was taken out on this home.
Original Mortgage
$500,000
Interest Rate
4.21%
Mortgage Type
New Conventional
Purchase Details
Closed on
Mar 22, 2000
Sold by
K & K Homes Inc
Bought by
Kennedy James A
Home Financials for this Owner
Home Financials are based on the most recent Mortgage that was taken out on this home.
Original Mortgage
$750,000
Interest Rate
7.99%
Mortgage Type
New Conventional
Purchase Details
Closed on
Oct 29, 1998
Sold by
Westerra Windward Llc
Bought by
K & K Homes Inc
Home Financials for this Owner
Home Financials are based on the most recent Mortgage that was taken out on this home.
Original Mortgage
$644,900
Interest Rate
6.58%
Mortgage Type
New Conventional
Create a Home Valuation Report for This Property
The Home Valuation Report is an in-depth analysis detailing your home's value as well as a comparison with similar homes in the area
Home Values in the Area
Average Home Value in this Area
Purchase History
| Date | Buyer | Sale Price | Title Company |
|---|---|---|---|
| Johnson Craig N | $1,194,000 | -- | |
| Kennedy James A | $750,000 | -- | |
| K & K Homes Inc | $185,000 | -- |
Source: Public Records
Mortgage History
| Date | Status | Borrower | Loan Amount |
|---|---|---|---|
| Closed | Johnson Craig N | $500,000 | |
| Previous Owner | Kennedy James A | $750,000 | |
| Previous Owner | K & K Homes Inc | $644,900 |
Source: Public Records
Tax History Compared to Growth
Tax History
| Year | Tax Paid | Tax Assessment Tax Assessment Total Assessment is a certain percentage of the fair market value that is determined by local assessors to be the total taxable value of land and additions on the property. | Land | Improvement |
|---|---|---|---|---|
| 2025 | $2,969 | $516,400 | $183,280 | $333,120 |
| 2023 | $14,576 | $516,400 | $183,280 | $333,120 |
| 2022 | $13,586 | $516,400 | $183,280 | $333,120 |
| 2021 | $16,485 | $501,360 | $177,960 | $323,400 |
| 2020 | $16,617 | $495,400 | $175,840 | $319,560 |
| 2019 | $2,798 | $486,640 | $172,720 | $313,920 |
| 2018 | $13,414 | $475,240 | $168,680 | $306,560 |
| 2017 | $11,752 | $402,800 | $80,040 | $322,760 |
| 2016 | $11,755 | $402,800 | $80,040 | $322,760 |
| 2015 | $14,033 | $402,800 | $80,040 | $322,760 |
| 2014 | $12,347 | $402,800 | $80,040 | $322,760 |
Source: Public Records
Map
Nearby Homes
- 2195 Lake Shore Landing
- 6105 Harbour Overlook
- 1605 Spinnaker Dr
- 1585 Spinnaker Dr
- 410 Red Jacket Way
- 1200 Bay Pointe Terrace
- 10 Club Ct
- 515 Martha Way
- 520 Flying Scot Way
- 6165 Pin Oak Ln
- 222 Mossy Place
- 1075 Carnoustie Ln
- 8110 Willow Tree Way
- 4440 Webb Bridge Rd
- 2800 Lakewind Ct
- 1140 Park Glenn Dr
- 1620 Silverleaf Way
- 2250 Blackheath Trace
- 535 Tumbling Creek Dr Unit 6
- 410 Fox Chase Cir
- 2170 Lake Shore Landing
- 2190 Lake Shore Landing
- 2200 Lake Shore Landing
- 2205 Lake Shore Landing
- 2160 Lake Shore Landing
- 2185 Lake Shore Landing
- 2210 Lake Shore Landing
- 2215 Lake Shore Landing
- 2150 Lake Shore Landing
- 2220 Lake Shore Landing
- 2165 Lake Shore Landing
- 2140 Lake Shore Landing
- 1175 Lake Shore Overlook
- 1165 Lake Shore Overlook
- 6145 Harbour Overlook
- 2225 Lake Shore Landing
- 6035 Harbour Overlook
- 2230 Lake Shore Landing
- 2130 Lake Shore Landing
- 2155 Lake Shore Landing