2180 N Pebble Brook Dr Pleasant View, UT 84404
Estimated Value: $473,000 - $542,000
3
Beds
3
Baths
2,704
Sq Ft
$184/Sq Ft
Est. Value
About This Home
This home is located at 2180 N Pebble Brook Dr, Pleasant View, UT 84404 and is currently estimated at $496,271, approximately $183 per square foot. 2180 N Pebble Brook Dr is a home located in Weber County with nearby schools including Majestic Elementary School, Orion Junior High School, and Weber High School.
Ownership History
Date
Name
Owned For
Owner Type
Purchase Details
Closed on
Apr 24, 2013
Sold by
Hernandez Manuel and Hernandez Andrea
Bought by
Hernandez Andrea and Hernandez Manuel
Current Estimated Value
Home Financials for this Owner
Home Financials are based on the most recent Mortgage that was taken out on this home.
Original Mortgage
$222,424
Outstanding Balance
$157,214
Interest Rate
3.5%
Mortgage Type
FHA
Estimated Equity
$339,057
Purchase Details
Closed on
Apr 17, 2008
Sold by
Destiny Homes
Bought by
Hernandez Manuel and Hernandez Andrea
Home Financials for this Owner
Home Financials are based on the most recent Mortgage that was taken out on this home.
Original Mortgage
$222,508
Interest Rate
5.99%
Mortgage Type
FHA
Purchase Details
Closed on
Jan 30, 2007
Sold by
Northeastern Developers Llc
Bought by
Destiny Homes
Create a Home Valuation Report for This Property
The Home Valuation Report is an in-depth analysis detailing your home's value as well as a comparison with similar homes in the area
Home Values in the Area
Average Home Value in this Area
Purchase History
| Date | Buyer | Sale Price | Title Company |
|---|---|---|---|
| Hernandez Andrea | -- | Security Title Of Davis Coun | |
| Hernandez Manuel | -- | Equity Title Layton | |
| Destiny Homes | -- | Heritage West Title Ins |
Source: Public Records
Mortgage History
| Date | Status | Borrower | Loan Amount |
|---|---|---|---|
| Open | Hernandez Andrea | $222,424 | |
| Closed | Hernandez Manuel | $222,508 |
Source: Public Records
Tax History Compared to Growth
Tax History
| Year | Tax Paid | Tax Assessment Tax Assessment Total Assessment is a certain percentage of the fair market value that is determined by local assessors to be the total taxable value of land and additions on the property. | Land | Improvement |
|---|---|---|---|---|
| 2025 | $3,036 | $452,624 | $140,026 | $312,598 |
| 2024 | $2,779 | $244,749 | $77,014 | $167,735 |
| 2023 | $2,760 | $251,900 | $77,002 | $174,898 |
| 2022 | $2,602 | $242,000 | $71,501 | $170,499 |
| 2021 | $2,192 | $345,000 | $75,004 | $269,996 |
| 2020 | $2,091 | $304,000 | $59,981 | $244,019 |
| 2019 | $1,983 | $275,000 | $49,993 | $225,007 |
| 2018 | $1,874 | $249,000 | $49,993 | $199,007 |
| 2017 | $1,784 | $224,000 | $48,926 | $175,074 |
| 2016 | $1,696 | $116,079 | $24,150 | $91,929 |
| 2015 | $1,541 | $104,326 | $24,150 | $80,176 |
| 2014 | $1,506 | $100,150 | $21,455 | $78,695 |
Source: Public Records
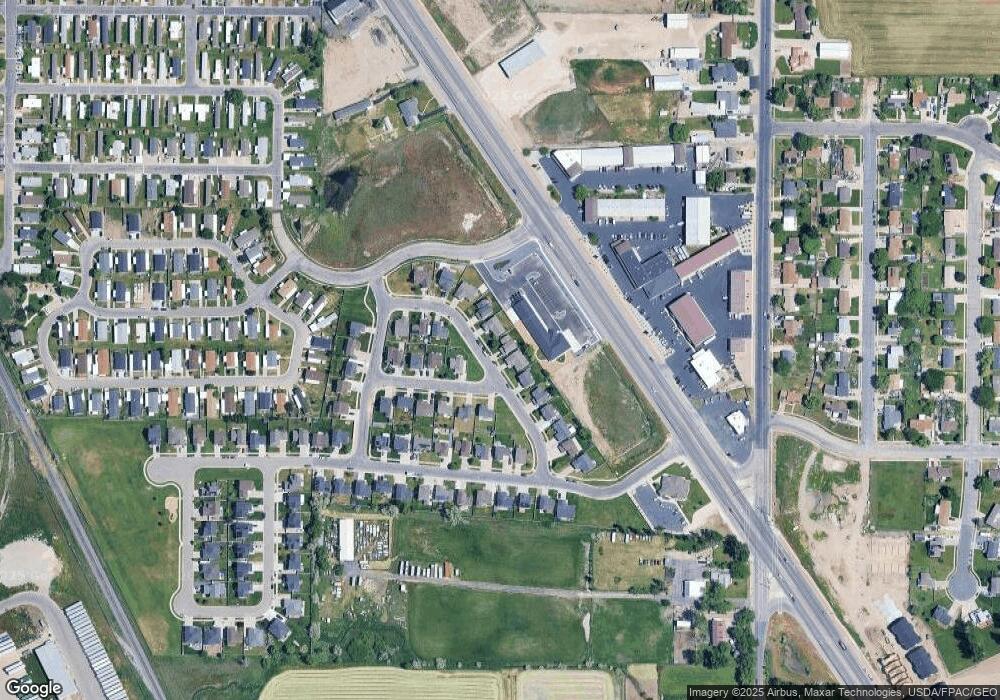
Map
Nearby Homes
- 2270 N 750 W
- 2205 N 700 W
- 2491 N Highway 89 Unit 314
- 2491 N Highway 89 Unit 427
- 2491 N Highway 89 Unit 302
- 2491 N Highway 89 Unit 323
- 2491 N Highway 89 Unit 125
- 1573 W 2700 N
- 759 W Fox Meadow Dr
- 416 W 1925 N
- 615 Fox Meadow Dr
- 2540 N 450 W
- 600 W 2700 N
- 1272 N 350 W Unit 158
- 2303 N 300 W
- 1030 W 1600 N
- 3323 1200 West St
- 1953 N 275 W Unit 13
- 1960 N 275 W Unit 29
- 2474 N Dorchester Ave
- 2180 Pebblebrook Rd
- 2200 Pebblebrook Rd
- 2160 Pebblebrook Rd
- 846 W 2150 N
- 2150 N Pebble Brook Dr
- 2220 Pebblebrook Rd
- 2150 Pebblebrook Rd
- 849 W Pebble Brook Dr
- 849 Pebblebrook Rd
- 862 W 2150 N
- 2144 N Pebble Brook Dr
- 827 W 2150 N
- 2144 Pebblebrook Rd
- 2240 Pebblebrook Rd
- 835 W 2150 N
- 867 Pebblebrook Rd
- 847 W 2150 N
- 874 W 2150 N
- 2138 Pebblebrook Rd
- 850 Pebblebrook Rd