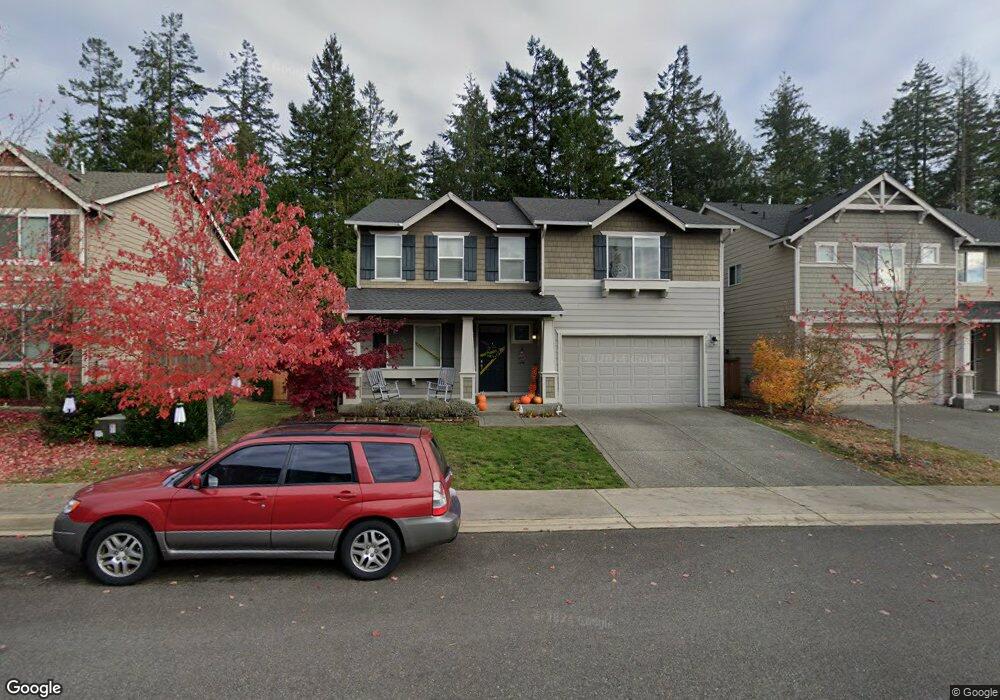
21800 NW Monterey Loop Poulsbo, WA 98370
Estimated Value: $684,000 - $748,000
4
Beds
2
Baths
2,688
Sq Ft
$264/Sq Ft
Est. Value
About This Home
This home is located at 21800 NW Monterey Loop, Poulsbo, WA 98370 and is currently estimated at $710,462, approximately $264 per square foot. 21800 NW Monterey Loop is a home located in Kitsap County with nearby schools including Vinland Elementary School, Poulsbo Middle School, and North Kitsap High School.
Ownership History
Date
Name
Owned For
Owner Type
Purchase Details
Closed on
May 6, 2021
Sold by
Sims Cody M and Sims Whitney M
Bought by
Korst William Everett and Brown Kathryn Sean
Current Estimated Value
Purchase Details
Closed on
Oct 22, 2018
Sold by
Duque Rodolfo O and Duque Maricar C
Bought by
Sims Cody M and Sims Neil Whitney M
Home Financials for this Owner
Home Financials are based on the most recent Mortgage that was taken out on this home.
Original Mortgage
$438,000
Interest Rate
4.6%
Mortgage Type
VA
Purchase Details
Closed on
Jun 11, 2012
Sold by
The Quadrant Corporation
Bought by
Duque Rodolfo O and Duque Maricar C
Home Financials for this Owner
Home Financials are based on the most recent Mortgage that was taken out on this home.
Original Mortgage
$337,600
Interest Rate
3.79%
Mortgage Type
VA
Create a Home Valuation Report for This Property
The Home Valuation Report is an in-depth analysis detailing your home's value as well as a comparison with similar homes in the area
Home Values in the Area
Average Home Value in this Area
Purchase History
| Date | Buyer | Sale Price | Title Company |
|---|---|---|---|
| Korst William Everett | $625,000 | Pacific Northwest Ttl Silver | |
| Sims Cody M | $438,000 | Pacific Northwest Title Silv | |
| Duque Rodolfo O | $330,801 | First American Title Ins |
Source: Public Records
Mortgage History
| Date | Status | Borrower | Loan Amount |
|---|---|---|---|
| Previous Owner | Sims Cody M | $438,000 | |
| Previous Owner | Duque Rodolfo O | $337,600 |
Source: Public Records
Tax History Compared to Growth
Tax History
| Year | Tax Paid | Tax Assessment Tax Assessment Total Assessment is a certain percentage of the fair market value that is determined by local assessors to be the total taxable value of land and additions on the property. | Land | Improvement |
|---|---|---|---|---|
| 2026 | $5,433 | $617,480 | $105,800 | $511,680 |
| 2025 | $5,433 | $617,480 | $105,800 | $511,680 |
| 2024 | $5,263 | $616,610 | $98,930 | $517,680 |
| 2023 | $5,352 | $616,610 | $98,930 | $517,680 |
| 2022 | $5,142 | $564,300 | $85,880 | $478,420 |
| 2021 | $4,975 | $505,870 | $76,940 | $428,930 |
| 2020 | $4,833 | $483,190 | $73,510 | $409,680 |
| 2019 | $4,534 | $453,640 | $68,700 | $384,940 |
| 2018 | $4,321 | $367,620 | $52,130 | $315,490 |
| 2017 | $4,120 | $367,620 | $52,130 | $315,490 |
| 2016 | $4,201 | $345,090 | $52,130 | $292,960 |
| 2015 | $4,040 | $333,820 | $52,130 | $281,690 |
| 2014 | -- | $292,830 | $52,130 | $240,700 |
| 2013 | -- | $292,830 | $52,130 | $240,700 |
Source: Public Records
Map
Nearby Homes
- 21728 Urdahl Rd NW
- 21988 Urdahl Rd NW
- 21555 Urdahl Rd NW
- 1949 Malbec St NW
- 1881 Claret Loop NW
- 1854 Claret Loop NW
- 22176 Jameson Ave NW Unit 84
- 22175 Jameson Ave NW Unit 79
- 22194 Jameson Ave NW Unit 26
- 22200 Jameson Ave NW Unit 25
- 1815 NW Nahele Ct Unit 75
- 1436 NW Swenson Ct Unit 23
- 1448 NW Swenson Ct Unit 21
- 1475 NW Swenson Ct Unit 33
- 1454 NW Swenson Ct Unit 20
- 1460 NW Swenson Ct Unit 19
- 1466 NW Swenson Ct Unit 18
- 1845 NW Nahele Ct Unit 58
- 1472 NW Swenson Ct Unit 17
- 1499 NW Swenson Ct Unit 37
- 21800 NW Monterey Lp
- 21820 NW Monterey Lp
- 21788 NW Monterey Lp
- 21772 NW Monterey Lp
- 21842 NW Monterey Lp
- 21821 Windmill Loop NW
- 21821 Windmill Loop NW
- 21790 Windmill Loop NW
- 21758 NW Monterey Lp
- 21864 NW Monterey Loop
- 21864 NW Monterey Lp
- 21819 Windmill Loop NW
- 21881 Monterey Loop
- 21786 Windmill Loop NW
- 21740 NW Monterey Lp
- 21740 NW Monterey Loop
- 21817 Windmill Loop NW
- 21817 Windmill Loop NW
- 21759 NW Monterey Lp
- 21883 NW Monterey Loop