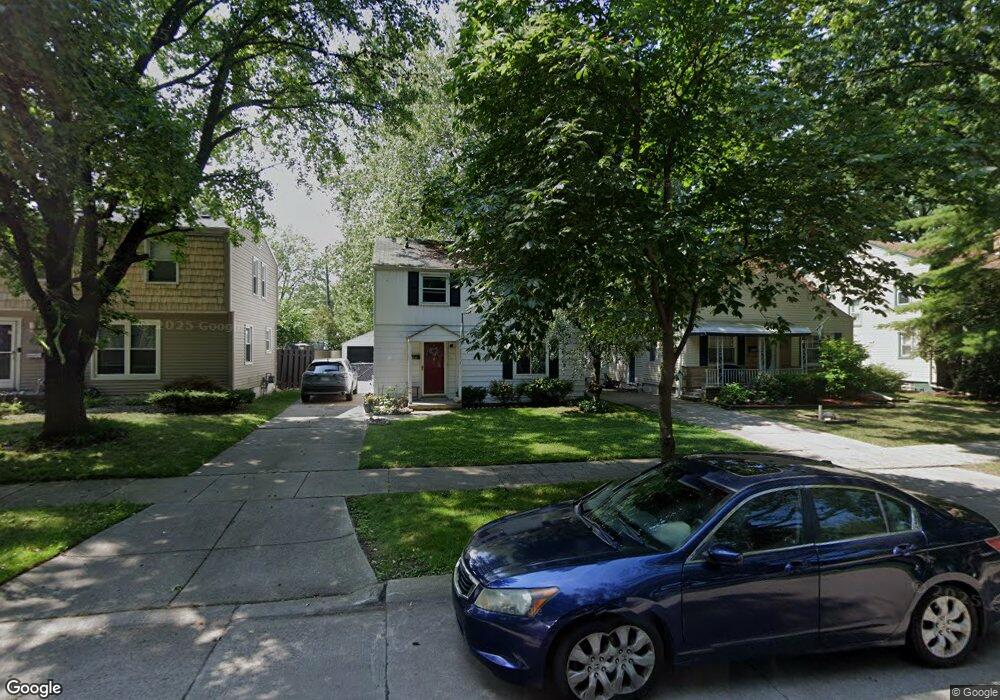
2181 Hampton Rd Unit Bldg-Unit Grosse Pointe Woods, MI 48236
Estimated Value: $220,000 - $248,000
3
Beds
2
Baths
1,386
Sq Ft
$171/Sq Ft
Est. Value
About This Home
This home is located at 2181 Hampton Rd Unit Bldg-Unit, Grosse Pointe Woods, MI 48236 and is currently estimated at $236,514, approximately $170 per square foot. 2181 Hampton Rd Unit Bldg-Unit is a home located in Wayne County with nearby schools including Stevens T. Mason Elementary School, Parcells Middle School, and Grosse Pointe North High School.
Ownership History
Date
Name
Owned For
Owner Type
Purchase Details
Closed on
Aug 8, 2018
Sold by
Harkenrider Glenn S
Bought by
Sylvester Veronica
Current Estimated Value
Purchase Details
Closed on
Feb 14, 2005
Sold by
Gilmore Thomas
Bought by
Harkenrider Glenn S
Purchase Details
Closed on
Sep 30, 2004
Sold by
Gilmore Angela
Bought by
Gilmore Thomas
Purchase Details
Closed on
May 25, 1995
Sold by
Carroll Margaret M
Bought by
Craig C and Engel Marisa E
Create a Home Valuation Report for This Property
The Home Valuation Report is an in-depth analysis detailing your home's value as well as a comparison with similar homes in the area
Home Values in the Area
Average Home Value in this Area
Purchase History
| Date | Buyer | Sale Price | Title Company |
|---|---|---|---|
| Sylvester Veronica | $122,500 | Devon Title Co | |
| Harkenrider Glenn S | $131,000 | Multiple | |
| Gilmore Thomas | -- | -- | |
| Craig C | $80,000 | -- |
Source: Public Records
Tax History
| Year | Tax Paid | Tax Assessment Tax Assessment Total Assessment is a certain percentage of the fair market value that is determined by local assessors to be the total taxable value of land and additions on the property. | Land | Improvement |
|---|---|---|---|---|
| 2025 | $2,673 | $104,800 | $0 | $0 |
| 2024 | $2,661 | $97,600 | $0 | $0 |
| 2023 | $2,559 | $87,200 | $0 | $0 |
| 2022 | $4,007 | $76,100 | $0 | $0 |
| 2021 | $3,820 | $70,200 | $0 | $0 |
| 2020 | $3,933 | $70,000 | $0 | $0 |
| 2019 | $3,850 | $66,500 | $0 | $0 |
| 2018 | $1,258 | $51,300 | $0 | $0 |
| 2017 | $2,287 | $51,900 | $0 | $0 |
| 2016 | $2,390 | $49,200 | $0 | $0 |
| 2015 | $3,455 | $44,600 | $0 | $0 |
| 2013 | $3,280 | $34,100 | $0 | $0 |
| 2012 | -- | $39,200 | $10,100 | $29,100 |
Source: Public Records
Map
Nearby Homes
- 2138 Ridgemont Rd
- 2223 Ridgemont Rd
- 2202 Hollywood Ave
- 2204 Roslyn Rd
- 20925 Ridgemont Rd
- 20919 Hollywood St
- 20927 Hawthorne St
- 21618 Woodbridge St
- 2029 Shorepointe Ln
- 20857 Hawthorne St
- 21800 Chalon St
- 2145 Vernier Rd
- 21731 Edmunton St
- 22050 Mauer St
- 20629 Hollywood St
- 1809 Roslyn Rd
- 21931 Mauer St
- 1793 Roslyn Rd
- 1781 Brys Dr
- 20535 Ridgemont Rd
- 2181 Hampton Rd
- 2189 Hampton Rd
- 2175 Hampton Rd
- 2189 Hampton Rd
- 2203 Hampton Rd
- 2169 Hampton Rd
- 2209 Hampton Rd
- 2180 Ridgemont Rd
- 2174 Ridgemont Rd
- 2174 Hampton Rd
- 2188 Ridgemont Rd
- 2168 Ridgemont Rd
- 2196 Ridgemont Rd
- 2153 Hampton 2153 Hampton Rd
- 2202 Ridgemont Rd
- 2160 Ridgemont Rd
- 2180 Hampton Rd Unit Bldg-Unit
- 2180 Hampton Rd
- 2153 Hampton Rd
- 2217 Hampton Rd
Your Personal Tour Guide
Ask me questions while you tour the home.