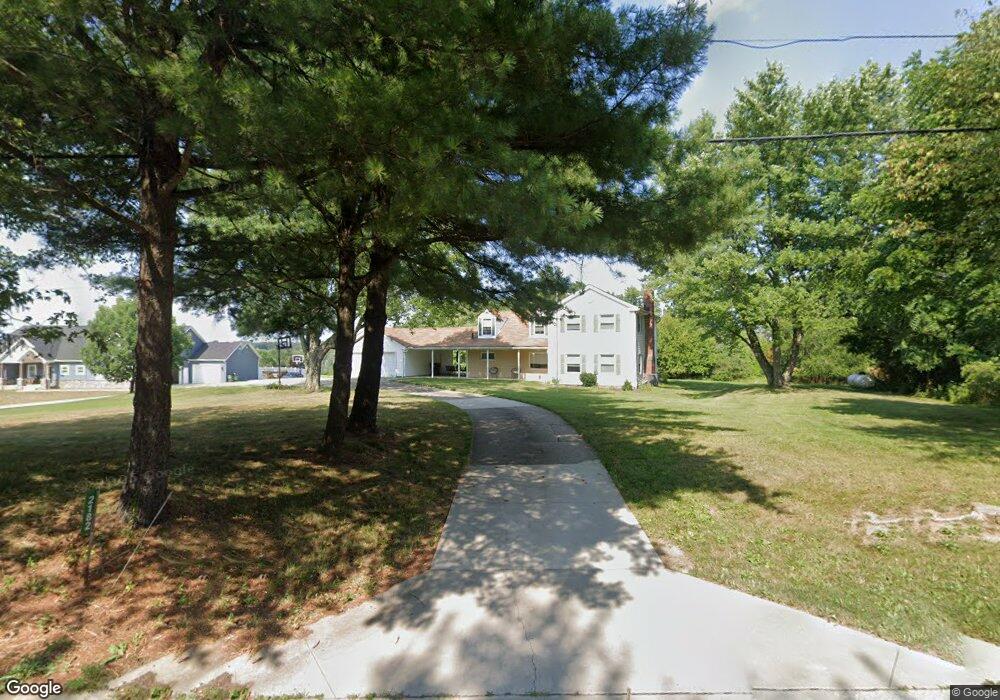
2182 Richville Dr SW Massillon, OH 44646
Southeast Massillon NeighborhoodEstimated Value: $257,000 - $356,000
3
Beds
2
Baths
2,454
Sq Ft
$124/Sq Ft
Est. Value
About This Home
This home is located at 2182 Richville Dr SW, Massillon, OH 44646 and is currently estimated at $303,139, approximately $123 per square foot. 2182 Richville Dr SW is a home located in Stark County with nearby schools including Pfeiffer Intermediate School, Edison Middle School, and Perry High School.
Ownership History
Date
Name
Owned For
Owner Type
Purchase Details
Closed on
Oct 7, 2024
Sold by
Equity Trust Company
Bought by
Bracken Micah D
Current Estimated Value
Home Financials for this Owner
Home Financials are based on the most recent Mortgage that was taken out on this home.
Original Mortgage
$238,135
Outstanding Balance
$235,560
Interest Rate
6.2%
Mortgage Type
New Conventional
Estimated Equity
$67,579
Purchase Details
Closed on
Jan 6, 2010
Sold by
Reidenbach Mark J
Bought by
Equity Trust Company and 13490 Ira
Purchase Details
Closed on
Oct 6, 1999
Sold by
Mcrobie Walter and Mcrobie Mabel I
Bought by
Reidenbach Mark J and Reidenbach Traci S
Home Financials for this Owner
Home Financials are based on the most recent Mortgage that was taken out on this home.
Original Mortgage
$84,800
Interest Rate
9.6%
Create a Home Valuation Report for This Property
The Home Valuation Report is an in-depth analysis detailing your home's value as well as a comparison with similar homes in the area
Home Values in the Area
Average Home Value in this Area
Purchase History
| Date | Buyer | Sale Price | Title Company |
|---|---|---|---|
| Bracken Micah D | $245,500 | None Listed On Document | |
| Equity Trust Company | $72,100 | None Available | |
| Reidenbach Mark J | $106,000 | Cta |
Source: Public Records
Mortgage History
| Date | Status | Borrower | Loan Amount |
|---|---|---|---|
| Open | Bracken Micah D | $238,135 | |
| Previous Owner | Reidenbach Mark J | $84,800 | |
| Closed | Reidenbach Mark J | $21,200 |
Source: Public Records
Tax History Compared to Growth
Tax History
| Year | Tax Paid | Tax Assessment Tax Assessment Total Assessment is a certain percentage of the fair market value that is determined by local assessors to be the total taxable value of land and additions on the property. | Land | Improvement |
|---|---|---|---|---|
| 2025 | -- | $68,850 | $10,360 | $58,490 |
| 2024 | -- | $68,850 | $10,360 | $58,490 |
| 2023 | $2,605 | $50,860 | $8,890 | $41,970 |
| 2022 | $2,620 | $50,860 | $8,890 | $41,970 |
| 2021 | $2,787 | $50,860 | $8,890 | $41,970 |
| 2020 | $2,417 | $42,390 | $7,490 | $34,900 |
| 2019 | $2,186 | $37,660 | $7,490 | $30,170 |
| 2018 | $1,926 | $37,660 | $7,490 | $30,170 |
| 2017 | $1,941 | $35,150 | $6,200 | $28,950 |
| 2016 | $1,951 | $35,150 | $6,200 | $28,950 |
| 2015 | $1,969 | $35,150 | $6,200 | $28,950 |
| 2014 | $1,915 | $33,640 | $5,920 | $27,720 |
| 2013 | $915 | $33,640 | $5,920 | $27,720 |
Source: Public Records
Map
Nearby Homes
- 2132 University Commons Dr SE Unit 2132
- 2160 Championship Cir SE
- Lot #28 Championship Cir SE
- Lot #47 Championship Cir SE
- Lot #51 Championship Cir SE
- 2335 Southway St SW
- 1572 Championship Cir SE
- 1553 Championship Cir SE
- 2950 Southway St SW
- Lot 19 Candell St SE
- Lot# 3 Candell St SE
- Lot# 7 Candell St SE
- Lot# 10 Candell St SE
- Lot# 9 Candell St SE
- Lot# 2 Candell St SE
- Lot 24 Candell Ave SW
- Lot# 5 Candell St SE
- Lot# 14 Candell St SE
- Lot# 6 Candell St SE
- Lot# 17 Candell St SE
- 2174 Richville Dr SW
- 1731 Jackson Ave SW
- 2167 Richville Dr SW
- 2282 Jackson Ave SW
- 2226 Richville Dr SW
- 197 Bowling Green Dr SE
- 1730 Jackson Ave SW
- 2225 Richville Dr SW
- 2232 Jackson Ave SW
- 2550 Heidelberg Ave SE
- 1606 Jackson Ave SW
- 2538 Heidelberg Ave SE
- 1525 Jackson Ave SW
- 2291 Richville Dr SW
- 2522 Heidelberg Ave SE
- 2566 Heidelberg Ave SE
- 2500 Heidelberg Ave SE
- 2490 Heidelberg Ave SE
- 2468 Heidelberg Ave SE
- 2561 Heidelberg Ave SE