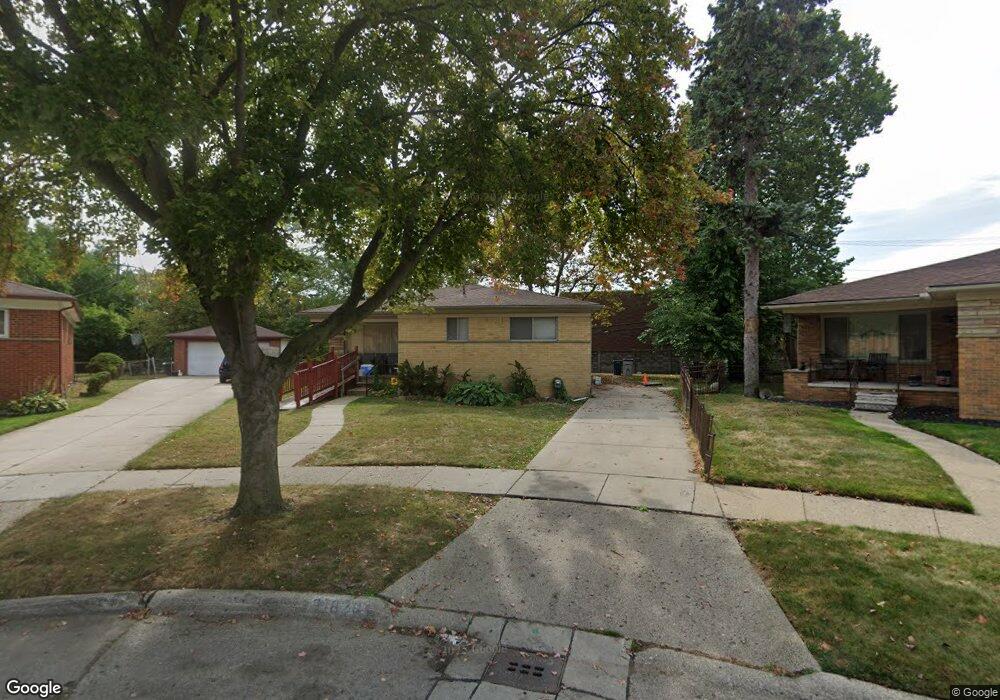
21820 Beverly St Oak Park, MI 48237
Estimated Value: $222,000 - $275,000
4
Beds
3
Baths
1,504
Sq Ft
$167/Sq Ft
Est. Value
About This Home
This home is located at 21820 Beverly St, Oak Park, MI 48237 and is currently estimated at $251,489, approximately $167 per square foot. 21820 Beverly St is a home located in Oakland County with nearby schools including Pepper Elementary School, Oak Park Service Learning Academy, and Oak Park Service Learning Academy Opsla.
Ownership History
Date
Name
Owned For
Owner Type
Purchase Details
Closed on
Feb 19, 2024
Sold by
Shah Daksha N
Bought by
Shah Daksha N and Shah Navinchandra N
Current Estimated Value
Home Financials for this Owner
Home Financials are based on the most recent Mortgage that was taken out on this home.
Original Mortgage
$157,500
Outstanding Balance
$154,758
Interest Rate
6.69%
Mortgage Type
New Conventional
Estimated Equity
$96,731
Purchase Details
Closed on
Dec 5, 2007
Sold by
Mortgage Electronic Registration Systems
Bought by
Lasalle Bank Na
Purchase Details
Closed on
Dec 4, 2007
Sold by
Coleman Vernetta T and Farrington Walter
Bought by
Mortgage Electronic Registration Systems
Purchase Details
Closed on
Jan 11, 2006
Sold by
Coleman Vernetta T
Bought by
Williams Levone and Williams Ima
Purchase Details
Closed on
Jan 5, 1999
Sold by
Ward Christopher Wardell
Bought by
Central Mortgage Corp
Create a Home Valuation Report for This Property
The Home Valuation Report is an in-depth analysis detailing your home's value as well as a comparison with similar homes in the area
Home Values in the Area
Average Home Value in this Area
Purchase History
| Date | Buyer | Sale Price | Title Company |
|---|---|---|---|
| Shah Daksha N | -- | None Listed On Document | |
| Shah Daksha N | -- | None Listed On Document | |
| Lasalle Bank Na | -- | None Available | |
| Mortgage Electronic Registration Systems | $97,750 | None Available | |
| Williams Levone | -- | None Available | |
| Central Mortgage Corp | $34,969 | -- |
Source: Public Records
Mortgage History
| Date | Status | Borrower | Loan Amount |
|---|---|---|---|
| Open | Shah Daksha N | $157,500 | |
| Closed | Shah Daksha N | $157,500 |
Source: Public Records
Tax History Compared to Growth
Tax History
| Year | Tax Paid | Tax Assessment Tax Assessment Total Assessment is a certain percentage of the fair market value that is determined by local assessors to be the total taxable value of land and additions on the property. | Land | Improvement |
|---|---|---|---|---|
| 2024 | $2,631 | $109,700 | $15,000 | $94,700 |
| 2023 | $2,519 | $96,300 | $13,200 | $83,100 |
| 2022 | $2,418 | $83,100 | $11,700 | $71,400 |
| 2021 | $2,393 | $78,500 | $6,000 | $72,500 |
| 2020 | $2,329 | $65,000 | $6,000 | $59,000 |
| 2018 | $2,316 | $40,900 | $0 | $0 |
| 2015 | -- | $31,600 | $0 | $0 |
| 2014 | -- | $27,600 | $0 | $0 |
| 2011 | -- | $37,500 | $0 | $0 |
Source: Public Records
Map
Nearby Homes
- 15241 Pearson St
- 21810 Stratford St
- 22150 Beverly St
- 14610 Pearson St
- 21961 Whitmore St
- 22160 Whitmore St
- 22020 Sussex St
- 23041 Marlow St
- 23040 Marlow St
- 23131 Harding St
- 23110 Wildwood St
- 16260 Mayfair Dr Unit 102
- 16275 W 9 Mile Rd
- 14211 Northend Ave
- 23136 Wildwood St
- 23091 Sussex St
- 23343 Cornerstone Village Dr Unit G114
- 23324 Poplar Dr Unit E89
- 21310 Gardner St
- 23040 Church St
- 21821 Beverly St
- 21830 Beverly St
- 21840 Beverly St
- 21831 Beverly St
- 21841 Beverly St
- 21851 Avon Rd
- 21850 Beverly St
- 21841 Avon Rd
- 21861 Avon Rd
- 21831 Avon Rd
- 21851 Beverly St
- 21821 Avon Rd
- 21860 Beverly St
- 21865 Avon Rd
- 21861 Beverly St Unit Bldg-Unit
- 21861 Beverly St
- 21811 Avon Rd
- 21870 Beverly St
- 21871 Avon Rd
- 21871 Beverly St