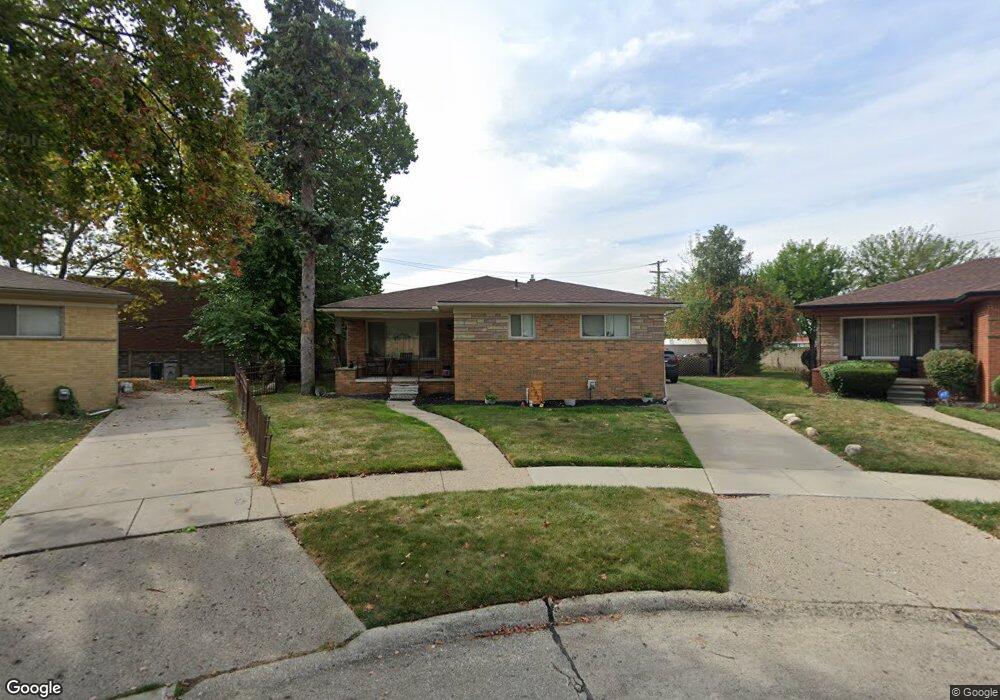
21821 Beverly St Oak Park, MI 48237
Estimated Value: $251,000 - $266,000
3
Beds
3
Baths
1,506
Sq Ft
$171/Sq Ft
Est. Value
About This Home
This home is located at 21821 Beverly St, Oak Park, MI 48237 and is currently estimated at $258,205, approximately $171 per square foot. 21821 Beverly St is a home located in Oakland County with nearby schools including Pepper Elementary School, Oak Park Service Learning Academy, and Oak Park Service Learning Academy Opsla.
Ownership History
Date
Name
Owned For
Owner Type
Purchase Details
Closed on
Nov 28, 2022
Sold by
Bean Algie Lamar
Bought by
Johnson Porsha J and Norwood Dellastine
Current Estimated Value
Home Financials for this Owner
Home Financials are based on the most recent Mortgage that was taken out on this home.
Original Mortgage
$208,331
Outstanding Balance
$202,227
Interest Rate
7.08%
Mortgage Type
FHA
Estimated Equity
$55,978
Purchase Details
Closed on
May 31, 2022
Sold by
Sheriff Of Oakland County
Bought by
Ge Capital Llc
Purchase Details
Closed on
Jun 26, 2006
Sold by
Bean Sharon
Bought by
Bean Algie L
Purchase Details
Closed on
Feb 2, 1996
Sold by
Harris Virignia
Bought by
Bean Algie L
Home Financials for this Owner
Home Financials are based on the most recent Mortgage that was taken out on this home.
Original Mortgage
$69,500
Interest Rate
7.11%
Create a Home Valuation Report for This Property
The Home Valuation Report is an in-depth analysis detailing your home's value as well as a comparison with similar homes in the area
Home Values in the Area
Average Home Value in this Area
Purchase History
| Date | Buyer | Sale Price | Title Company |
|---|---|---|---|
| Johnson Porsha J | $212,175 | Peak Title | |
| Johnson Porsha J | $212,175 | Peak Title | |
| Ge Capital Llc | $142,858 | Hamson John T | |
| Ge Capital Llc | $142,858 | Hamson John T | |
| Bean Algie L | -- | None Available | |
| Bean Algie L | $78,000 | -- |
Source: Public Records
Mortgage History
| Date | Status | Borrower | Loan Amount |
|---|---|---|---|
| Open | Johnson Porsha J | $208,331 | |
| Previous Owner | Bean Algie L | $69,500 |
Source: Public Records
Tax History Compared to Growth
Tax History
| Year | Tax Paid | Tax Assessment Tax Assessment Total Assessment is a certain percentage of the fair market value that is determined by local assessors to be the total taxable value of land and additions on the property. | Land | Improvement |
|---|---|---|---|---|
| 2024 | $5,974 | $113,200 | $15,700 | $97,500 |
| 2023 | $5,730 | $99,400 | $13,900 | $85,500 |
| 2022 | $1,910 | $85,800 | $12,300 | $73,500 |
| 2021 | $1,902 | $80,900 | $6,300 | $74,600 |
| 2020 | $1,844 | $65,800 | $6,300 | $59,500 |
| 2018 | $1,854 | $42,400 | $0 | $0 |
| 2015 | -- | $32,800 | $0 | $0 |
| 2014 | -- | $28,600 | $0 | $0 |
| 2011 | -- | $38,900 | $0 | $0 |
Source: Public Records
Map
Nearby Homes
- 15241 Pearson St
- 22150 Beverly St
- 21810 Stratford St
- 21961 Whitmore St
- 14610 Pearson St
- 22160 Whitmore St
- 22020 Sussex St
- 23041 Marlow St
- 23131 Harding St
- 16260 Mayfair Dr Unit 102
- 16275 W 9 Mile Rd
- 23040 Marlow St
- 23110 Wildwood St
- 23343 Cornerstone Village Dr Unit G114
- 23324 Poplar Dr Unit E89
- 23136 Wildwood St
- 23091 Sussex St
- 14211 Northend Ave
- 15801 Providence Dr Unit 10C
- 16400 N Park Dr Unit 414
- 21820 Beverly St
- 21831 Beverly St
- 21830 Beverly St
- 21841 Beverly St
- 21840 Beverly St
- 21851 Beverly St
- 21850 Beverly St
- 21861 Beverly St Unit Bldg-Unit
- 21861 Beverly St
- 21851 Avon Rd
- 21841 Avon Rd
- 21861 Avon Rd
- 21860 Beverly St
- 21831 Avon Rd
- 21821 Avon Rd
- 21871 Beverly St
- 21865 Avon Rd
- 21811 Avon Rd
- 21870 Beverly St
- 21881 Beverly St