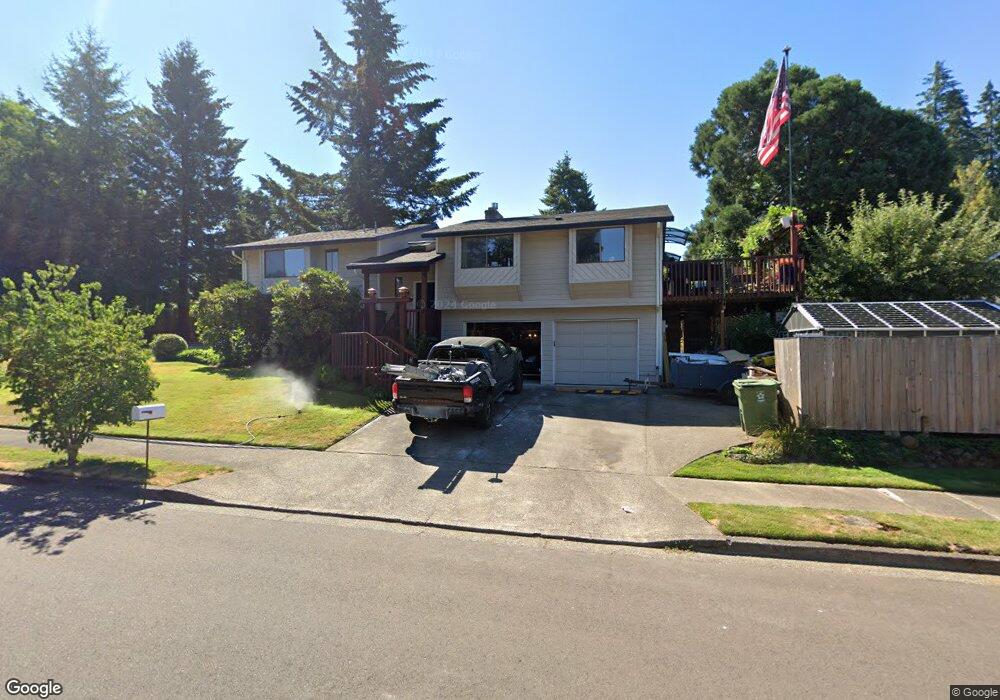
21828 SW Mandan Ct Tualatin, OR 97062
Estimated Value: $612,000 - $724,000
3
Beds
3
Baths
1,600
Sq Ft
$413/Sq Ft
Est. Value
About This Home
This home is located at 21828 SW Mandan Ct, Tualatin, OR 97062 and is currently estimated at $660,905, approximately $413 per square foot. 21828 SW Mandan Ct is a home located in Washington County with nearby schools including Byrom Elementary School, Hazelbrook Middle School, and Tualatin High School.
Ownership History
Date
Name
Owned For
Owner Type
Purchase Details
Closed on
Feb 11, 2019
Sold by
Ffq Properties Llc
Bought by
Spohn Lisa Louise and The Lisa Louise Spohn Trust
Current Estimated Value
Purchase Details
Closed on
Dec 27, 1999
Sold by
Quinn Frank Y and Quinn Marian F
Bought by
Ffo Properties Llc
Purchase Details
Closed on
Jun 23, 1999
Sold by
Quinn Frank Y and Quinn Marian Fay
Bought by
Quinn Frank Y and Quinn Marian F
Purchase Details
Closed on
Oct 1, 1996
Sold by
Quinn Frank Y and Bresee Robert A
Bought by
Quinn Frank Y and Quinn Marian F
Home Financials for this Owner
Home Financials are based on the most recent Mortgage that was taken out on this home.
Original Mortgage
$105,950
Interest Rate
7.95%
Purchase Details
Closed on
Jun 3, 1996
Sold by
Kjemperud Misty R
Bought by
Quinn Frank Y and Bresee Robert A
Create a Home Valuation Report for This Property
The Home Valuation Report is an in-depth analysis detailing your home's value as well as a comparison with similar homes in the area
Home Values in the Area
Average Home Value in this Area
Purchase History
| Date | Buyer | Sale Price | Title Company |
|---|---|---|---|
| Spohn Lisa Louise | -- | None Available | |
| Ffo Properties Llc | $180,000 | -- | |
| Quinn Frank Y | -- | Oregon Title Insurance Co | |
| Quinn Frank Y | -- | Oregon Title Insurance Co | |
| Quinn Frank Y | $163,000 | Oregon Title Insurance Co |
Source: Public Records
Mortgage History
| Date | Status | Borrower | Loan Amount |
|---|---|---|---|
| Previous Owner | Quinn Frank Y | $105,950 |
Source: Public Records
Tax History Compared to Growth
Tax History
| Year | Tax Paid | Tax Assessment Tax Assessment Total Assessment is a certain percentage of the fair market value that is determined by local assessors to be the total taxable value of land and additions on the property. | Land | Improvement |
|---|---|---|---|---|
| 2025 | $5,814 | $341,820 | -- | -- |
| 2024 | $5,662 | $331,870 | -- | -- |
| 2023 | $5,662 | $297,270 | $0 | $0 |
| 2022 | $4,998 | $297,270 | $0 | $0 |
| 2021 | $4,876 | $280,220 | $0 | $0 |
| 2020 | $4,731 | $272,060 | $0 | $0 |
| 2019 | $4,604 | $264,140 | $0 | $0 |
| 2018 | $4,417 | $256,450 | $0 | $0 |
| 2017 | $4,159 | $248,990 | $0 | $0 |
| 2016 | $3,965 | $241,740 | $0 | $0 |
| 2015 | $3,805 | $234,700 | $0 | $0 |
| 2014 | $3,697 | $227,870 | $0 | $0 |
Source: Public Records
Map
Nearby Homes
- 21932 SW Creek Dr
- 8811 SW Salinan St
- 8821 SW Salinan St
- 8829 Salinan St
- 8836 Salinan St
- 8904 Salinan St
- 8715 SW Tachi Ct
- 22222 SW Mandan Dr
- 22338 SW Pinto Dr
- 8263 SW Blake St
- 21150 SW Arapaho Ct
- 8501 SW Iroquois Dr
- 8895 SW Iowa Dr
- 22040 SW Grahams Ferry Rd Unit B
- 9433 SW Siuslaw Ln
- 20916 SW Siletz Ct
- 22030 SW Grahams Ferry Rd Unit D
- 22000 SW Grahams Ferry Rd Unit C
- 22538 SW 96th Dr
- 9388 SW Vermillion Dr Unit H235
- 21833 SW Dakota Dr
- 21856 SW Mandan Ct
- 21767 SW Dakota Dr
- 8600 SW Mandan Dr
- 21845 SW Mandan Ct
- 21884 SW Mandan Ct
- 21850 SW Dakota Dr
- 21867 SW Mandan Ct
- 21888 SW Dakota Dr
- 8605 SW Mandan Dr
- 21903 SW Dakota Dr
- 8576 SW Mandan Dr
- 21914 SW Mandan Ct
- 21889 SW Mandan Ct
- 21926 SW Dakota Dr
- 21801 SW Creek Dr
- 21911 SW Mandan Ct
- 8583 SW Mandan Dr
- 21919 SW Mandan Ct
- 21919 SW Mandan Ct