Estimated Value: $546,000 - $567,000
4
Beds
3
Baths
1,714
Sq Ft
$322/Sq Ft
Est. Value
About This Home
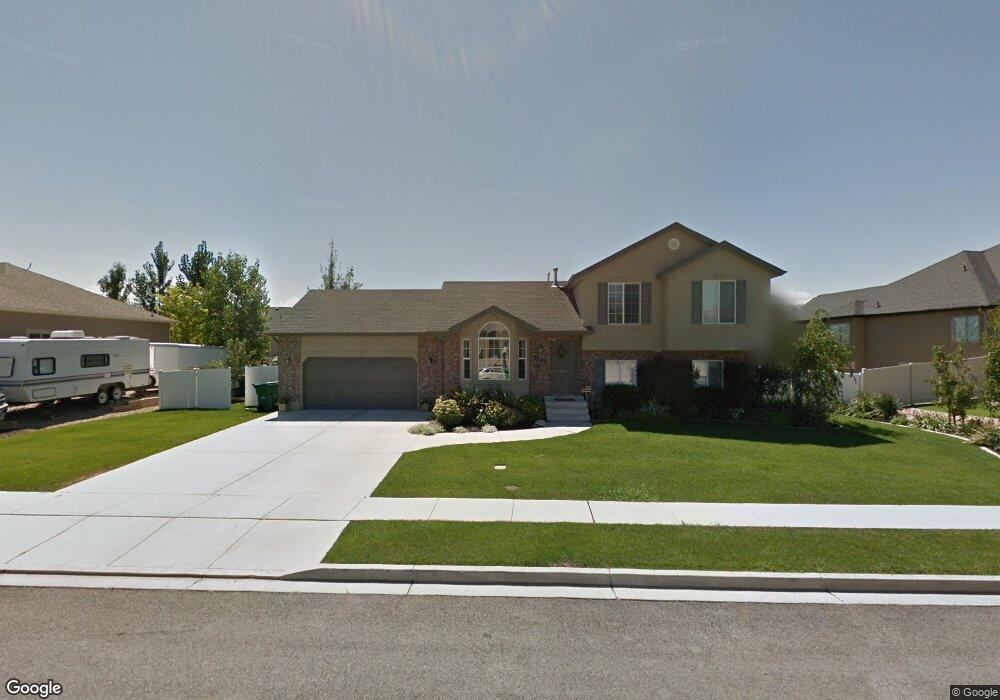
This home is located at 2183 W 1170 S, Lehi, UT 84043 and is currently estimated at $552,080, approximately $322 per square foot. 2183 W 1170 S is a home located in Utah County with nearby schools including Dry Creek Elementary School, Willowcreek Middle School, and Lehi High School.
Ownership History
Date
Name
Owned For
Owner Type
Purchase Details
Closed on
Apr 11, 2024
Sold by
Yu Stephanie L and Huang Cindy Xiu
Bought by
Yu Stephanie L and Wei Xiaoyu
Current Estimated Value
Purchase Details
Closed on
Nov 22, 2017
Sold by
Yu Stephanie L
Bought by
Yu Stephanie L and Huang Cindy Xiu Ying
Home Financials for this Owner
Home Financials are based on the most recent Mortgage that was taken out on this home.
Original Mortgage
$237,600
Interest Rate
3.91%
Mortgage Type
New Conventional
Purchase Details
Closed on
Nov 21, 2017
Sold by
Hoyal Samuel E and Hoyal Ashley
Bought by
Yu Stephine L
Home Financials for this Owner
Home Financials are based on the most recent Mortgage that was taken out on this home.
Original Mortgage
$237,600
Interest Rate
3.91%
Mortgage Type
New Conventional
Purchase Details
Closed on
Jul 8, 2005
Sold by
Luck Wayne R
Bought by
Oldham Development Lc
Create a Home Valuation Report for This Property
The Home Valuation Report is an in-depth analysis detailing your home's value as well as a comparison with similar homes in the area
Home Values in the Area
Average Home Value in this Area
Purchase History
| Date | Buyer | Sale Price | Title Company |
|---|---|---|---|
| Yu Stephanie L | -- | Cottonwood Title | |
| Yu Stephanie L | -- | Founders Title Co | |
| Yu Stephine L | -- | Eagle Gate Title Ins Agency | |
| Oldham Development Lc | -- | Eagle Pointe Title Insurance | |
| Hoyal Samuel E | -- | Eagle Pointe Title Insuranc | |
| Oldham Development Lc | -- | Eagle Pointe Title Insuranc |
Source: Public Records
Mortgage History
| Date | Status | Borrower | Loan Amount |
|---|---|---|---|
| Previous Owner | Yu Stephanie L | $237,600 |
Source: Public Records
Tax History Compared to Growth
Tax History
| Year | Tax Paid | Tax Assessment Tax Assessment Total Assessment is a certain percentage of the fair market value that is determined by local assessors to be the total taxable value of land and additions on the property. | Land | Improvement |
|---|---|---|---|---|
| 2025 | $2,245 | $280,500 | $250,300 | $259,700 |
| 2024 | $2,076 | $262,680 | $0 | $0 |
| 2023 | $2,076 | $263,835 | $0 | $0 |
| 2022 | $2,056 | $253,220 | $0 | $0 |
| 2021 | $1,778 | $331,200 | $144,800 | $186,400 |
| 2020 | $1,675 | $308,300 | $134,100 | $174,200 |
| 2019 | $1,559 | $298,300 | $134,100 | $164,200 |
| 2018 | $1,504 | $272,100 | $123,200 | $148,900 |
| 2017 | $1,445 | $138,985 | $0 | $0 |
| 2016 | $1,557 | $138,985 | $0 | $0 |
| 2015 | $1,508 | $134,420 | $0 | $0 |
| 2014 | $1,470 | $123,750 | $0 | $0 |
Source: Public Records
Map
Nearby Homes
- The McKenzie Plan at South Creek
- The Tracie Plan at South Creek
- The Michelle Plan at South Creek
- The Roosevelt Plan at South Creek
- The Avery Plan at South Creek
- The Madison Plan at South Creek
- The Evelyn Plan at South Creek
- The Brandy Plan at South Creek
- The Eleanor Plan at South Creek
- The Christine Plan at South Creek
- 1137 E Commodore Ln
- 2190 W Cape Fox Way Unit 219
- 1133 E Commodore Ln
- 928 Gander Way
- 1406 1960 W
- 1178 E Trident Dr
- 811 S 2300 W
- 1154 E Trident Dr
- 1186 E Dogwatch Dr
- 453 N Northshore Dr
- 2161 W 1170 S
- 2207 W 1170 S
- 2207 W 1170 S Unit 35
- 2182 W 1235 S
- 1219 S 2220 W
- 1156 S 2160 W
- 2156 W 1235 S
- 1157 S 2220 W
- 1157 S 2220 W Unit 23
- 2139 W 1170 S
- 1159 S 2160 W
- 1112 S 2220 W Unit 21
- 2132 W 1235 S
- 1138 S 2160 W
- 1194 S 2220 W
- 1218 S 2220 W
- 2193 W 1235 S
- 2171 W 1235 S
- 2171 W 1235 S Unit 40
- 1137 S 2220 W