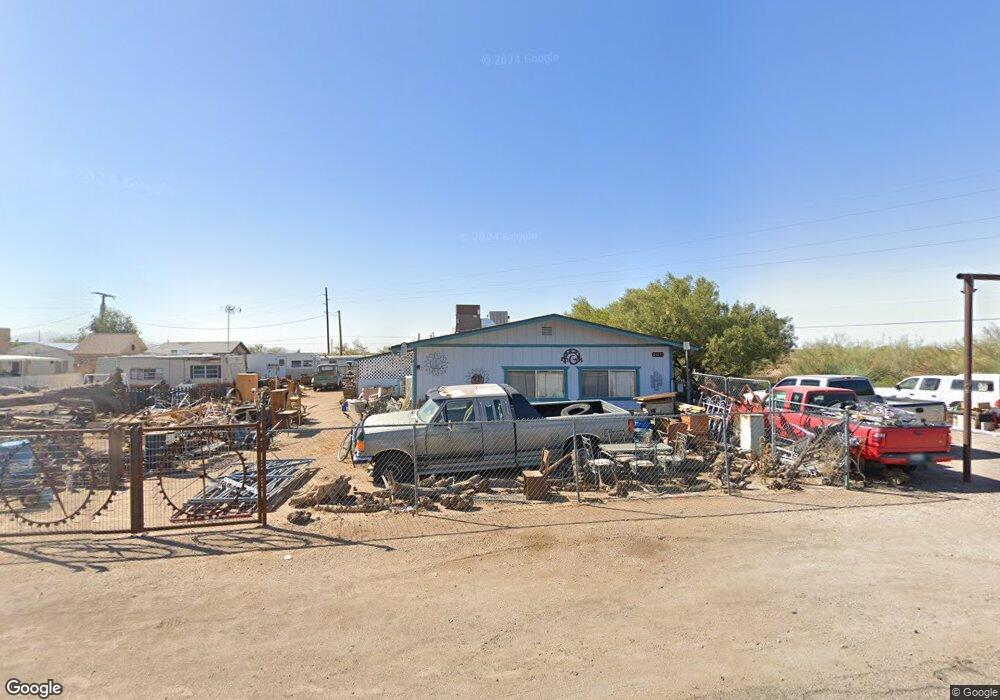
21835 W Harding St Wittmann, AZ 85361
Estimated Value: $239,604 - $343,000
3
Beds
2
Baths
1,512
Sq Ft
$193/Sq Ft
Est. Value
About This Home
This home is located at 21835 W Harding St, Wittmann, AZ 85361 and is currently estimated at $292,151, approximately $193 per square foot. 21835 W Harding St is a home located in Maricopa County with nearby schools including Nadaburg Elementary School.
Ownership History
Date
Name
Owned For
Owner Type
Purchase Details
Closed on
Jan 18, 2011
Sold by
Smith Sharon M
Bought by
Rose Ronald E and Rose Connie J
Current Estimated Value
Purchase Details
Closed on
Nov 11, 2009
Sold by
Deutsche Bank National Trust Company
Bought by
Smith Sharon M
Purchase Details
Closed on
Sep 9, 2009
Sold by
Hernandez Hipolita C
Bought by
Deutsche Bank National Trust Company
Purchase Details
Closed on
Jul 7, 2005
Sold by
Arenivas Gregorio R
Bought by
Arenivas Hipolita C
Purchase Details
Closed on
Jul 7, 2004
Sold by
Arenivas Gregorio R
Bought by
Arenivas Hipolita C
Purchase Details
Closed on
Mar 15, 2001
Sold by
Thibedeau Gene and Thibedeau Janet
Bought by
Arenivas Gregorio R and Arenivas Hipolita C
Home Financials for this Owner
Home Financials are based on the most recent Mortgage that was taken out on this home.
Original Mortgage
$72,653
Interest Rate
7.06%
Mortgage Type
New Conventional
Create a Home Valuation Report for This Property
The Home Valuation Report is an in-depth analysis detailing your home's value as well as a comparison with similar homes in the area
Home Values in the Area
Average Home Value in this Area
Purchase History
| Date | Buyer | Sale Price | Title Company |
|---|---|---|---|
| Rose Ronald E | -- | None Available | |
| Smith Sharon M | $29,500 | Guaranty Title Agency | |
| Deutsche Bank National Trust Company | $111,600 | None Available | |
| Arenivas Hipolita C | -- | -- | |
| Arenivas Hipolita C | -- | -- | |
| Arenivas Gregorio R | $74,900 | First American Title |
Source: Public Records
Mortgage History
| Date | Status | Borrower | Loan Amount |
|---|---|---|---|
| Previous Owner | Arenivas Gregorio R | $72,653 |
Source: Public Records
Tax History Compared to Growth
Tax History
| Year | Tax Paid | Tax Assessment Tax Assessment Total Assessment is a certain percentage of the fair market value that is determined by local assessors to be the total taxable value of land and additions on the property. | Land | Improvement |
|---|---|---|---|---|
| 2025 | $447 | $4,498 | -- | -- |
| 2024 | $436 | $4,284 | -- | -- |
| 2023 | $436 | $20,370 | $4,070 | $16,300 |
| 2022 | $314 | $14,450 | $2,890 | $11,560 |
| 2021 | $361 | $13,600 | $2,720 | $10,880 |
| 2020 | $359 | $12,230 | $2,440 | $9,790 |
| 2019 | $326 | $9,150 | $1,830 | $7,320 |
| 2018 | $322 | $4,620 | $920 | $3,700 |
| 2017 | $324 | $3,600 | $720 | $2,880 |
| 2016 | $296 | $3,960 | $790 | $3,170 |
| 2015 | $280 | $3,220 | $640 | $2,580 |
Source: Public Records
Map
Nearby Homes
- 21770 W Harding Ave
- xxxxx W Griffin Ave Unit 4,5,6
- 0 Unit 7
- 0 W Griffin Ave Unit 3 & 4 6838221
- 0 S Center St Unit 2 6763625
- 32210 S Center St
- 32406 N Center St
- 21816 E Taft Ave
- 0 Mountain Side Loop Unit 12 6694748
- 0 W Myers Ave Unit 10 & 11 6862483
- 21543 W Myers Ave
- 32108 N Walnut St
- 32102 N Walnut St
- 284XY N Crozier Rd
- 35524 N 215th Ave
- 0 W Griffin Lot 1 Ave Unit 1 6838410
- 319xx N Poplar St Unit 9
- 0 N Poplar St Unit 3 6886521
- 32007 N Bush St
- 2 E Griffin Ave
- 21827 W Harding St
- 21828 W Harding St
- O N Crozier Rd Unit 4
- 21828 S Pine St
- 21817 W Harding St
- 000000 W Grand Ave Unit 7
- 21813 W Harding Ave
- 21813 W Harding St
- 21842 W Wilson Ave
- 21838 W Wilson Ave
- 21834 W Wilson Ave
- 21809 W Harding St
- 21805 W Harding St
- 21757 W Harding St
- 24700 W Grand Ave
- 23400 W Grand Ave
- 24700 W Grand Ave
- 23400 W Grand Ave
- 24700 W Grand Ave
- 24700 W Grand Ave