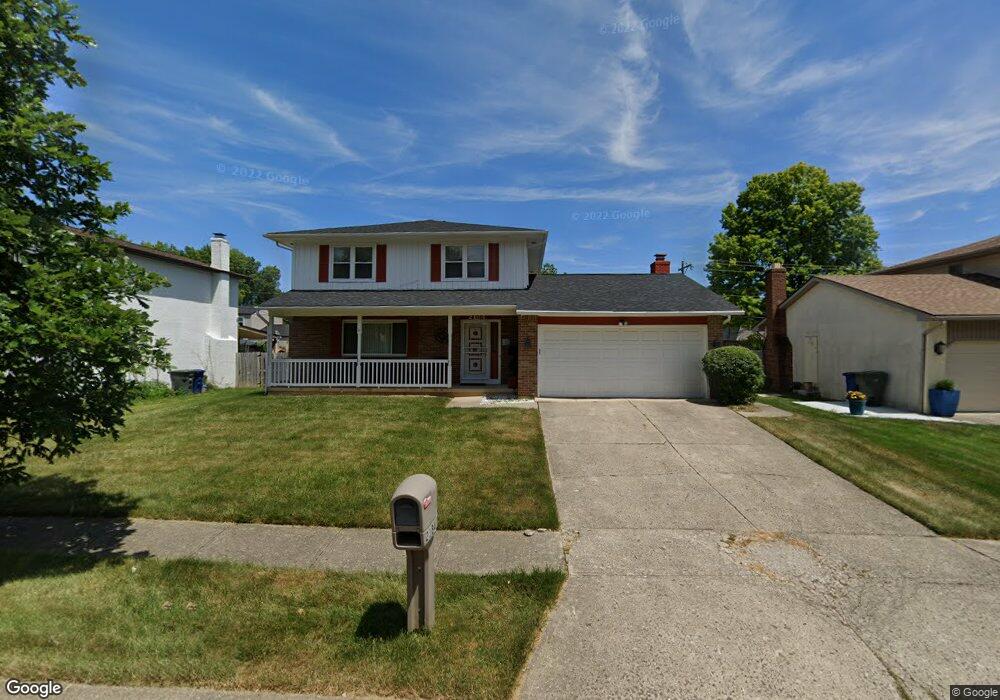
2184 Blackoak Ave Columbus, OH 43229
Forest Park East NeighborhoodEstimated Value: $250,000 - $321,000
3
Beds
3
Baths
1,506
Sq Ft
$191/Sq Ft
Est. Value
About This Home
This home is located at 2184 Blackoak Ave, Columbus, OH 43229 and is currently estimated at $286,907, approximately $190 per square foot. 2184 Blackoak Ave is a home located in Franklin County with nearby schools including Avalon Elementary School, Northgate Intermediate, and Woodward Park Middle School.
Ownership History
Date
Name
Owned For
Owner Type
Purchase Details
Closed on
Apr 26, 2002
Sold by
Whitcomb Kimberly L
Bought by
Alshawa Crystal L
Current Estimated Value
Home Financials for this Owner
Home Financials are based on the most recent Mortgage that was taken out on this home.
Original Mortgage
$121,241
Outstanding Balance
$50,249
Interest Rate
7.24%
Mortgage Type
FHA
Estimated Equity
$236,658
Purchase Details
Closed on
Sep 17, 1999
Sold by
Columbro Kimberly L and Columbro Kimberl
Bought by
Whitcomb Kimberly L
Home Financials for this Owner
Home Financials are based on the most recent Mortgage that was taken out on this home.
Original Mortgage
$128,046
Interest Rate
7.93%
Purchase Details
Closed on
Mar 8, 1993
Bought by
Colombro Kimberly L
Purchase Details
Closed on
Oct 31, 1989
Purchase Details
Closed on
Jul 1, 1986
Create a Home Valuation Report for This Property
The Home Valuation Report is an in-depth analysis detailing your home's value as well as a comparison with similar homes in the area
Home Values in the Area
Average Home Value in this Area
Purchase History
| Date | Buyer | Sale Price | Title Company |
|---|---|---|---|
| Alshawa Crystal L | $122,300 | -- | |
| Whitcomb Kimberly L | -- | Golden Title Agency Inc | |
| Colombro Kimberly L | -- | -- | |
| -- | $86,500 | -- | |
| -- | $75,000 | -- |
Source: Public Records
Mortgage History
| Date | Status | Borrower | Loan Amount |
|---|---|---|---|
| Open | Alshawa Crystal L | $121,241 | |
| Previous Owner | Whitcomb Kimberly L | $128,046 |
Source: Public Records
Tax History
| Year | Tax Paid | Tax Assessment Tax Assessment Total Assessment is a certain percentage of the fair market value that is determined by local assessors to be the total taxable value of land and additions on the property. | Land | Improvement |
|---|---|---|---|---|
| 2025 | $3,574 | $79,630 | $19,250 | $60,380 |
| 2024 | $3,574 | $79,630 | $19,250 | $60,380 |
| 2023 | $3,528 | $79,630 | $19,250 | $60,380 |
| 2022 | $2,939 | $56,670 | $12,290 | $44,380 |
| 2021 | $2,944 | $56,670 | $12,290 | $44,380 |
| 2020 | $2,948 | $56,670 | $12,290 | $44,380 |
| 2019 | $2,529 | $41,690 | $9,100 | $32,590 |
| 2018 | $2,374 | $41,690 | $9,100 | $32,590 |
| 2017 | $2,528 | $41,690 | $9,100 | $32,590 |
| 2016 | $2,451 | $37,000 | $8,540 | $28,460 |
| 2015 | $2,225 | $37,000 | $8,540 | $28,460 |
| 2014 | $2,230 | $37,000 | $8,540 | $28,460 |
| 2013 | $1,158 | $38,955 | $8,995 | $29,960 |
Source: Public Records
Map
Nearby Homes
- 2251 Tuliptree Ave
- 2259 Tuliptree Ave
- 2251 Minerva Ave
- 2236 Strimple Ave
- 2117 Kilbourne Ave
- 4885 Northtowne Blvd
- 2294 Teakwood Dr
- 5399 Teakwood Ct
- 5396 Teakwood Ct
- 2500 Maplewood Dr
- 5458 Sumac Loop S
- 1905 Denise Dr
- 2414 Taymouth Rd
- 5491 Parkshire Dr Unit 5491
- 5570 Maple Canyon Ave
- 5556 Parkshire Dr Unit 5556
- 2669 Alder Vista Dr
- 5485 Tamarack Blvd
- 4714 Ascot Dr
- 5018 Charming Ct
- 2174 Blackoak Ave
- 2192 Blackoak Ave
- 2185 Maplewood Dr
- 2177 Maplewood Dr
- 2166 Blackoak Ave
- 2202 Blackoak Ave
- 2195 Maplewood Dr
- 2167 Maplewood Dr
- 2185 Blackoak Ave
- 2193 Blackoak Ave
- 2177 Blackoak Ave
- 2203 Maplewood Dr
- 2156 Blackoak Ave
- 2159 Maplewood Dr
- 2212 Blackoak Ave
- 2203 Blackoak Ave
- 2165 Blackoak Ave
- 2211 Maplewood Dr
- 2211 Blackoak Ave
- 2157 Blackoak Ave
Your Personal Tour Guide
Ask me questions while you tour the home.