Estimated Value: $210,964 - $259,000
3
Beds
2
Baths
1,226
Sq Ft
$185/Sq Ft
Est. Value
About This Home
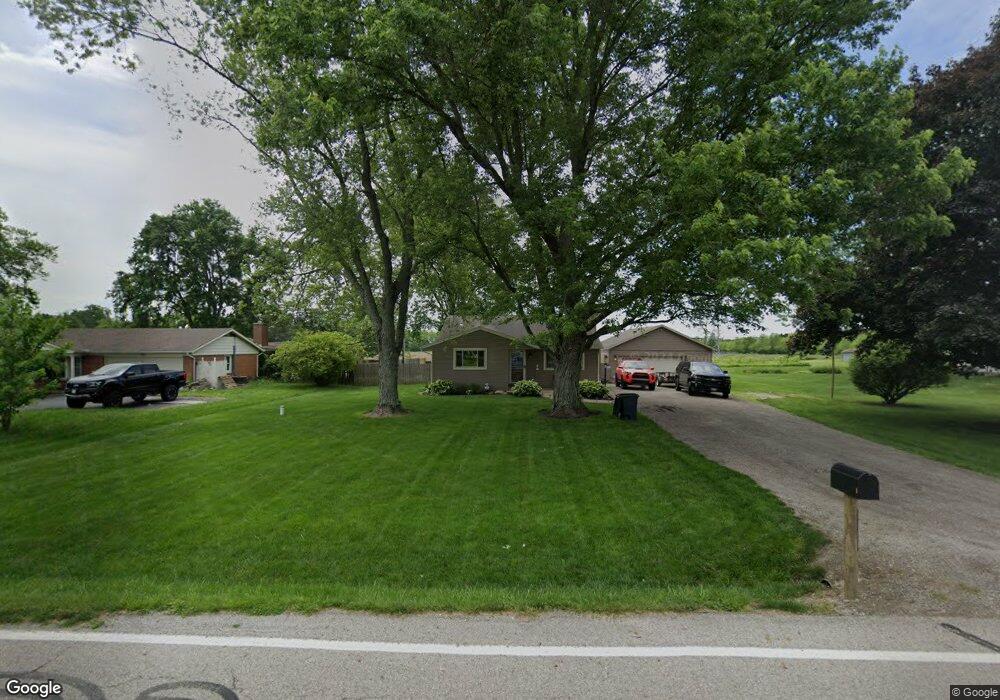
This home is located at 2184 Lefevre Rd, Troy, OH 45373 and is currently estimated at $226,491, approximately $184 per square foot. 2184 Lefevre Rd is a home located in Miami County with nearby schools including Miami East Elementary School, Miami East Junior High School, and Miami East High School.
Ownership History
Date
Name
Owned For
Owner Type
Purchase Details
Closed on
Nov 12, 2025
Sold by
Boyd Patricia L and Kline Patricia Louise
Bought by
Kline Patricia Louise
Current Estimated Value
Home Financials for this Owner
Home Financials are based on the most recent Mortgage that was taken out on this home.
Original Mortgage
$143,950
Outstanding Balance
$143,545
Interest Rate
6.34%
Mortgage Type
New Conventional
Estimated Equity
$82,946
Purchase Details
Closed on
Jul 31, 2015
Sold by
Boyd Patricia L
Bought by
Kline Todd C and Boyd Patricia L
Purchase Details
Closed on
Jul 16, 2004
Sold by
Mason Lillian C
Bought by
Boyd Patricia L
Home Financials for this Owner
Home Financials are based on the most recent Mortgage that was taken out on this home.
Original Mortgage
$96,678
Interest Rate
6.37%
Mortgage Type
FHA
Purchase Details
Closed on
Jan 1, 1990
Bought by
Mason Harold E
Create a Home Valuation Report for This Property
The Home Valuation Report is an in-depth analysis detailing your home's value as well as a comparison with similar homes in the area
Purchase History
| Date | Buyer | Sale Price | Title Company |
|---|---|---|---|
| Kline Patricia Louise | -- | Northwest Union Title | |
| Kline Todd C | -- | Hallmark Title | |
| Boyd Patricia L | $98,000 | -- | |
| Mason Harold E | -- | -- |
Source: Public Records
Mortgage History
| Date | Status | Borrower | Loan Amount |
|---|---|---|---|
| Open | Kline Patricia Louise | $143,950 | |
| Previous Owner | Boyd Patricia L | $96,678 |
Source: Public Records
Tax History
| Year | Tax Paid | Tax Assessment Tax Assessment Total Assessment is a certain percentage of the fair market value that is determined by local assessors to be the total taxable value of land and additions on the property. | Land | Improvement |
|---|---|---|---|---|
| 2024 | $1,891 | $41,730 | $12,640 | $29,090 |
| 2023 | $1,432 | $41,730 | $12,640 | $29,090 |
| 2022 | $1,471 | $41,730 | $12,640 | $29,090 |
| 2021 | $1,212 | $32,100 | $9,730 | $22,370 |
| 2020 | $1,218 | $32,100 | $9,730 | $22,370 |
| 2019 | $1,237 | $32,100 | $9,730 | $22,370 |
| 2018 | $1,168 | $29,650 | $7,420 | $22,230 |
| 2017 | $1,156 | $29,650 | $7,420 | $22,230 |
| 2016 | $1,087 | $29,650 | $7,420 | $22,230 |
| 2015 | $1,108 | $28,530 | $7,140 | $21,390 |
| 2014 | $1,108 | $28,530 | $7,140 | $21,390 |
| 2013 | $1,114 | $28,530 | $7,140 | $21,390 |
Source: Public Records
Map
Nearby Homes
- 1597 Old Staunton Rd
- 491 Mayfield Square E
- 1063 Linwood Dr
- 1206 Heritage Dr
- 1057 Stonyridge Ave
- 1008 Plymouth Ct
- 1142 Lee Rd
- 1257 Gettysburg Dr
- 1117 Scenic Ct
- 1728 Hunters Ridge Dr
- 1329 Lee Rd
- 1334 Skylark Dr
- 1075 Crestview Dr
- 555 Miami St
- 1424 Michael Dr
- 72 N Childrens Home Rd
- 1210 Charleston Ct
- 1400 Troy Urbana Rd
- 1119 Long St
- 506 Michigan Ave
- 2200 Lefevre Rd
- 2166 Lefevre Rd
- 2210 Lefevre Rd
- 2148 Lefevre Rd
- 2138 Lefevre Rd
- 2151 Lefevre Rd
- 2146 Lefevre Rd
- 2211 Lefevre Rd
- 2336 Lefevre Rd
- 2225 Lefevre Rd
- 2340 Lefevre Rd
- 2144 Lefevre Rd
- 2358 Lefevre Rd
- 2141 Lefevre Rd
- 2145 Lefevre Rd
- 2116 Lefevre Rd
- 2361 Lefevre Rd
- 2109 Lefevre Rd
- 2100 Lefevre Rd
- 2400 Lefevre Rd
Your Personal Tour Guide
Ask me questions while you tour the home.