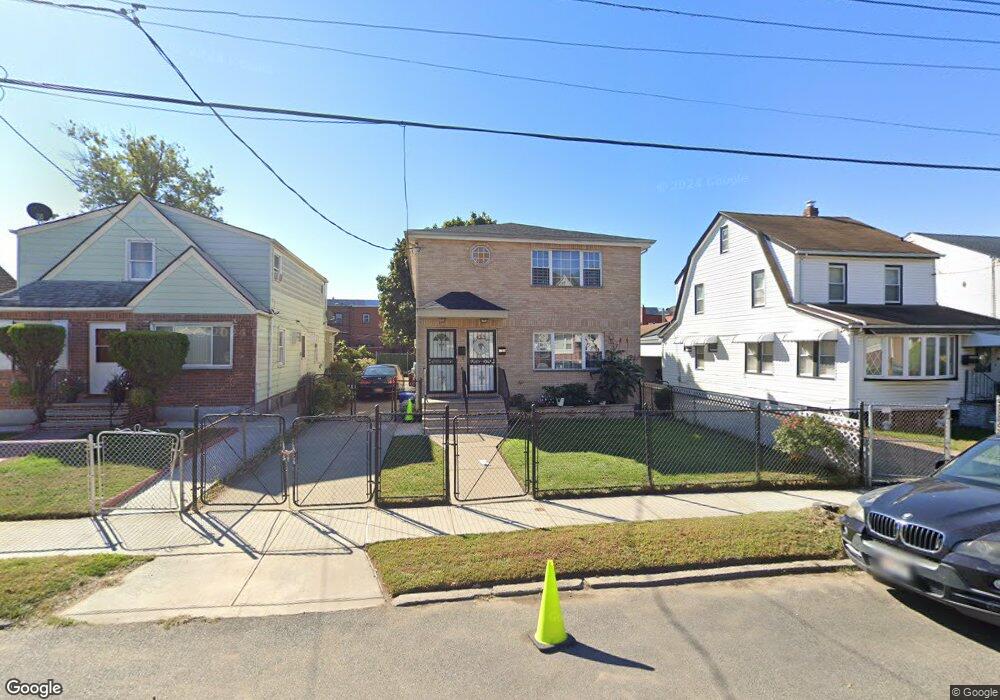
21840 113th Ave Queens Village, NY 11429
Queens Village NeighborhoodEstimated Value: $866,996 - $1,229,000
--
Bed
--
Bath
2,352
Sq Ft
$451/Sq Ft
Est. Value
About This Home
This home is located at 21840 113th Ave, Queens Village, NY 11429 and is currently estimated at $1,061,749, approximately $451 per square foot. 21840 113th Ave is a home located in Queens County with nearby schools including P.S./M.S. 147 Ronald Mcnair, I.S. 192 The Linden, and Ss Joachim & Anne School.
Ownership History
Date
Name
Owned For
Owner Type
Purchase Details
Closed on
Mar 3, 2021
Sold by
Ioni E Abrams Trust and Wayne F Abrams As Trustee
Bought by
Abrams Wayne F
Current Estimated Value
Purchase Details
Closed on
Aug 24, 2006
Sold by
118 Development Corp
Bought by
Abrams Ioni
Home Financials for this Owner
Home Financials are based on the most recent Mortgage that was taken out on this home.
Original Mortgage
$72,927
Outstanding Balance
$43,856
Interest Rate
6.79%
Estimated Equity
$1,017,893
Purchase Details
Closed on
Mar 10, 2006
Sold by
Estate Of Arlieta Williamson and Williamson As Administratrix
Bought by
118Th Development Corp
Home Financials for this Owner
Home Financials are based on the most recent Mortgage that was taken out on this home.
Original Mortgage
$247,875
Interest Rate
6.26%
Mortgage Type
Purchase Money Mortgage
Create a Home Valuation Report for This Property
The Home Valuation Report is an in-depth analysis detailing your home's value as well as a comparison with similar homes in the area
Home Values in the Area
Average Home Value in this Area
Purchase History
| Date | Buyer | Sale Price | Title Company |
|---|---|---|---|
| Abrams Wayne F | -- | -- | |
| Abrams Ioni | $730,000 | -- | |
| Abrams Ioni | $730,000 | -- | |
| 118Th Development Corp | $330,500 | -- | |
| 118Th Development Corp | $330,500 | -- |
Source: Public Records
Mortgage History
| Date | Status | Borrower | Loan Amount |
|---|---|---|---|
| Open | Abrams Ioni | $72,927 | |
| Closed | Abrams Ioni | $72,927 | |
| Open | Abrams Ioni | $584,000 | |
| Closed | Abrams Ioni | $584,000 | |
| Previous Owner | 118Th Development Corp | $247,875 |
Source: Public Records
Tax History Compared to Growth
Tax History
| Year | Tax Paid | Tax Assessment Tax Assessment Total Assessment is a certain percentage of the fair market value that is determined by local assessors to be the total taxable value of land and additions on the property. | Land | Improvement |
|---|---|---|---|---|
| 2025 | $8,013 | $42,290 | $12,942 | $29,348 |
| 2024 | $5,560 | $39,896 | $11,778 | $28,118 |
| 2023 | $7,560 | $37,639 | $12,259 | $25,380 |
| 2022 | $7,089 | $54,900 | $17,040 | $37,860 |
| 2021 | $7,473 | $49,740 | $17,040 | $32,700 |
| 2020 | $7,460 | $48,060 | $17,040 | $31,020 |
| 2019 | $6,955 | $44,520 | $17,040 | $27,480 |
| 2018 | $6,394 | $31,366 | $14,275 | $17,091 |
| 2017 | $6,032 | $29,592 | $12,811 | $16,781 |
| 2016 | $5,916 | $29,592 | $12,811 | $16,781 |
| 2015 | $3,367 | $29,369 | $15,574 | $13,795 |
| 2014 | $3,367 | $27,707 | $17,632 | $10,075 |
Source: Public Records
Map
Nearby Homes
- 112-29 219th St
- 21531 Murdock Ave
- 21438 112th Rd
- 214-38 113th Ave
- 215-28 112th Ave
- 219-47 112th Ave
- 22117 Murdock Ave
- 215-11 112th Ave
- 214-10 113th Ave
- 21739 114th Rd
- 217-39 114th Rd
- 113-66 Springfield Blvd
- 216-23 111th Ave
- 21231 113th Ave
- 215-16 111th Ave
- 114-36 220th St
- 21511 111th Rd
- 21867 110th Ave
- 11221 212th St
- 114-54 212th St
- 21636 113th Ave
- 21844 113th Ave
- 21848 113th Ave
- 21832 113th Ave
- 21832 113th Ave
- 21541 Murdock Ave
- 21543 Murdock Ave
- 21539 Murdock Ave
- 21545 Murdock Ave
- 21537 Murdock Ave
- 21547 Murdock Ave
- 11304 219th St
- 21535 Murdock Ave
- 21541 Murdock Ave
- 113-2 219th St
- 21537 Murdock Ave
- 218-26 113th Ave
- 21549 Murdock Ave
- 215-33 Murdock Ave
- 21533 Murdock Ave