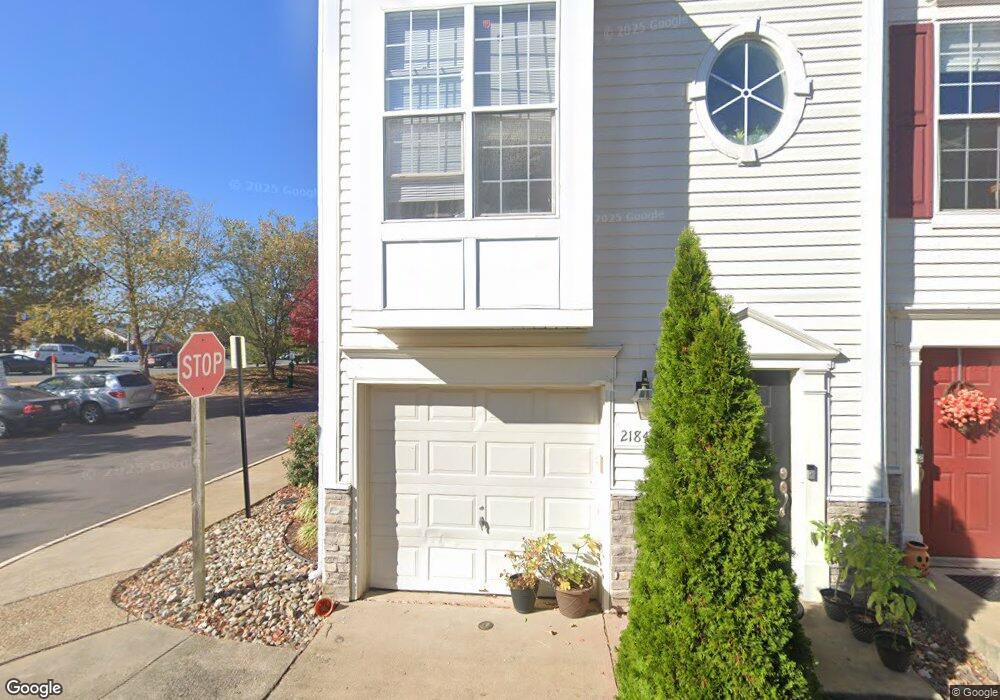
21849 Cobble Pond Square Unit 49 Ashburn, VA 20147
Estimated Value: $497,000 - $530,000
2
Beds
3
Baths
1,578
Sq Ft
$328/Sq Ft
Est. Value
About This Home
This home is located at 21849 Cobble Pond Square Unit 49, Ashburn, VA 20147 and is currently estimated at $518,163, approximately $328 per square foot. 21849 Cobble Pond Square Unit 49 is a home located in Loudoun County with nearby schools including Discovery Elementary School, Farmwell Station Middle School, and Broad Run High School.
Ownership History
Date
Name
Owned For
Owner Type
Purchase Details
Closed on
Aug 1, 2023
Sold by
Nekkanti Surendra
Bought by
Ahomes Llc
Current Estimated Value
Purchase Details
Closed on
Dec 21, 2015
Sold by
Sussman Brad
Bought by
Nekkanti Surendra
Home Financials for this Owner
Home Financials are based on the most recent Mortgage that was taken out on this home.
Original Mortgage
$276,300
Interest Rate
3.89%
Mortgage Type
New Conventional
Purchase Details
Closed on
May 13, 2009
Sold by
Deutsche Bk Natl Tr Co Tr
Bought by
Sussman Brad
Home Financials for this Owner
Home Financials are based on the most recent Mortgage that was taken out on this home.
Original Mortgage
$220,924
Interest Rate
4.91%
Mortgage Type
FHA
Purchase Details
Closed on
Nov 6, 2006
Sold by
Huang Xiao Mei
Bought by
Machado Nora E
Home Financials for this Owner
Home Financials are based on the most recent Mortgage that was taken out on this home.
Original Mortgage
$293,250
Interest Rate
6.31%
Mortgage Type
New Conventional
Create a Home Valuation Report for This Property
The Home Valuation Report is an in-depth analysis detailing your home's value as well as a comparison with similar homes in the area
Home Values in the Area
Average Home Value in this Area
Purchase History
| Date | Buyer | Sale Price | Title Company |
|---|---|---|---|
| Ahomes Llc | -- | Atd Title | |
| Nekkanti Surendra | $307,000 | Signature & Stewart Stlmnt | |
| Sussman Brad | $225,000 | -- | |
| Machado Nora E | $345,000 | -- |
Source: Public Records
Mortgage History
| Date | Status | Borrower | Loan Amount |
|---|---|---|---|
| Previous Owner | Nekkanti Surendra | $276,300 | |
| Previous Owner | Sussman Brad | $220,924 | |
| Previous Owner | Machado Nora E | $293,250 |
Source: Public Records
Tax History Compared to Growth
Tax History
| Year | Tax Paid | Tax Assessment Tax Assessment Total Assessment is a certain percentage of the fair market value that is determined by local assessors to be the total taxable value of land and additions on the property. | Land | Improvement |
|---|---|---|---|---|
| 2025 | $3,859 | $479,390 | $153,500 | $325,890 |
| 2024 | $3,970 | $458,980 | $153,500 | $305,480 |
| 2023 | $3,610 | $412,570 | $133,500 | $279,070 |
| 2022 | $3,442 | $386,750 | $123,500 | $263,250 |
| 2021 | $3,603 | $367,690 | $123,500 | $244,190 |
| 2020 | $3,692 | $356,670 | $90,000 | $266,670 |
| 2019 | $3,460 | $331,100 | $90,000 | $241,100 |
| 2018 | $3,389 | $312,390 | $90,000 | $222,390 |
| 2017 | $3,414 | $303,510 | $90,000 | $213,510 |
| 2016 | $3,458 | $302,040 | $0 | $0 |
| 2015 | $3,353 | $205,430 | $0 | $205,430 |
| 2014 | $3,261 | $215,810 | $0 | $215,810 |
Source: Public Records
Map
Nearby Homes
- 43740 Clear Lake Square
- 43769 Metro Terrace
- 43790 Metro Terrace Unit A
- Hayes Plan at Ashburn Station
- Addison Homesite Special Plan at Ashburn Station
- 43791 Metro Terrace Unit B
- Addison Plan at Ashburn Station
- 21755 Ladyslipper Square
- 21825 Express Terrace Unit 110
- 21825 Express Terrace
- 21799 Express Terrace Unit 1122A
- 21795 Express Terrace Unit 1124
- 21789 Express Terrace
- 21787 Express Terrace
- 43812 Middleway Terrace
- 43730 Transit Square
- 21783 Express Terrace Unit 1129A
- 43785 Transit Square
- 21854 Goodwood Terrace
- Elsdon Plan at The Flats at Waxpool Crossing
- 21849 Cobble Pond Square
- 21847 Cobble Pond Square
- 21847 Cobble Pond Terrace
- 21845 Cobble Pond Terrace Unit 47
- 21845 Cobble Pond Terrace
- 21845 Cobble Pond Square Unit 47
- 21849 Cobble Pond Terrace
- 21846 Cobble Pond Terrace
- 21848 Cobble Pond Terrace
- 21844 Cobble Pond Terrace
- 21842 Cobble Pond Terrace
- 21842 Cobble Pond Terrace Unit 43
- 21848 Cobble Pond Square
- 21840 Cobble Pond Terrace Unit 42
- 21840 Cobble Pond Terrace
- 21844 Cobble Pond Square
- 21846 Cobble Pond Square
- 21838 Cobble Pond Terrace
- 21847 Ryan Park Terrace
- 21845 Ryan Park Terrace