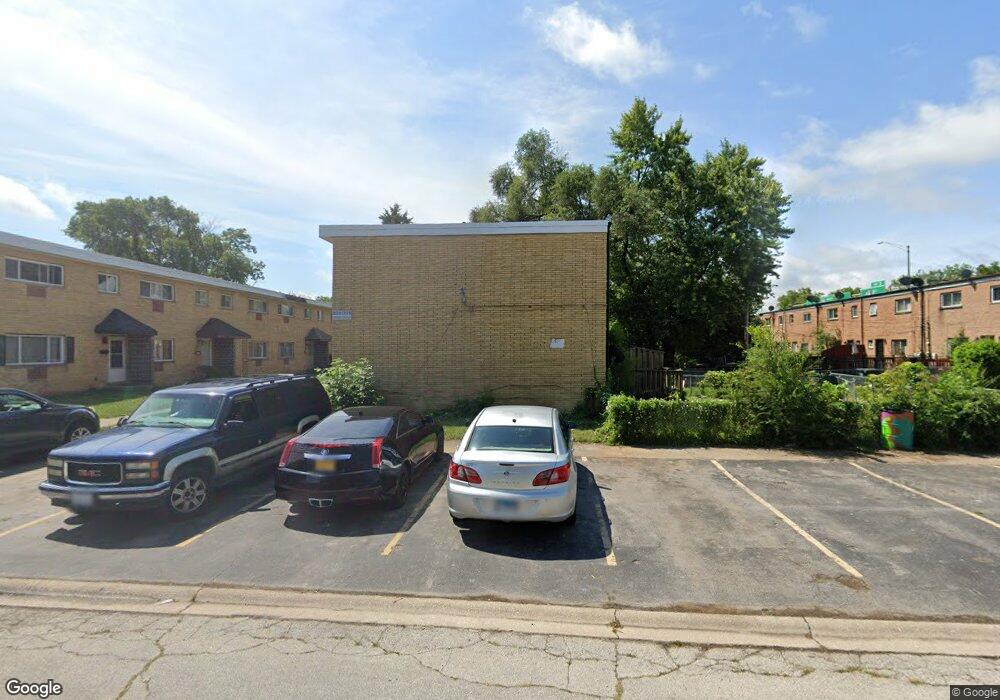
2185 171st St Hazel Crest, IL 60429
Hazel Crest Proper NeighborhoodEstimated Value: $111,000 - $124,000
3
Beds
2
Baths
1,120
Sq Ft
$102/Sq Ft
Est. Value
About This Home
This home is located at 2185 171st St, Hazel Crest, IL 60429 and is currently estimated at $114,466, approximately $102 per square foot. 2185 171st St is a home located in Cook County with nearby schools including Thornwood High School.
Ownership History
Date
Name
Owned For
Owner Type
Purchase Details
Closed on
Dec 29, 2023
Sold by
Ezaizat Randa
Bought by
Raintree Investments Llc
Current Estimated Value
Home Financials for this Owner
Home Financials are based on the most recent Mortgage that was taken out on this home.
Original Mortgage
$79,200
Outstanding Balance
$77,901
Interest Rate
7.29%
Mortgage Type
New Conventional
Estimated Equity
$36,565
Purchase Details
Closed on
Apr 20, 2022
Sold by
Yarbrough Karen A
Bought by
Ezaizat Randa
Purchase Details
Closed on
Oct 30, 1995
Sold by
Surta Paul
Bought by
Hickman Roger L
Home Financials for this Owner
Home Financials are based on the most recent Mortgage that was taken out on this home.
Original Mortgage
$56,610
Interest Rate
7.61%
Mortgage Type
FHA
Purchase Details
Closed on
Oct 26, 1995
Sold by
American National Bk & Tr Co Of Chicago
Bought by
Surta Paul
Home Financials for this Owner
Home Financials are based on the most recent Mortgage that was taken out on this home.
Original Mortgage
$56,610
Interest Rate
7.61%
Mortgage Type
FHA
Create a Home Valuation Report for This Property
The Home Valuation Report is an in-depth analysis detailing your home's value as well as a comparison with similar homes in the area
Home Values in the Area
Average Home Value in this Area
Purchase History
| Date | Buyer | Sale Price | Title Company |
|---|---|---|---|
| Raintree Investments Llc | $99,000 | Saturn Title | |
| Raintree Investments Llc | $99,000 | Saturn Title | |
| Ezaizat Randa | -- | None Listed On Document | |
| Hickman Roger L | $57,000 | -- | |
| Surta Paul | $27,500 | -- |
Source: Public Records
Mortgage History
| Date | Status | Borrower | Loan Amount |
|---|---|---|---|
| Open | Raintree Investments Llc | $79,200 | |
| Closed | Raintree Investments Llc | $79,200 | |
| Previous Owner | Hickman Roger L | $56,610 |
Source: Public Records
Tax History Compared to Growth
Tax History
| Year | Tax Paid | Tax Assessment Tax Assessment Total Assessment is a certain percentage of the fair market value that is determined by local assessors to be the total taxable value of land and additions on the property. | Land | Improvement |
|---|---|---|---|---|
| 2024 | $1,783 | $6,100 | $640 | $5,460 |
| 2023 | -- | $6,100 | $640 | $5,460 |
| 2022 | $0 | $3,234 | $560 | $2,674 |
| 2021 | $104 | $3,234 | $560 | $2,674 |
| 2020 | $104 | $3,234 | $560 | $2,674 |
| 2019 | $916 | $4,601 | $520 | $4,081 |
| 2018 | $887 | $4,601 | $520 | $4,081 |
| 2017 | $902 | $4,601 | $520 | $4,081 |
| 2016 | $1,467 | $4,668 | $480 | $4,188 |
| 2015 | $1,341 | $4,668 | $480 | $4,188 |
| 2014 | $1,359 | $4,668 | $480 | $4,188 |
| 2013 | $1,375 | $4,958 | $480 | $4,478 |
Source: Public Records
Map
Nearby Homes
- 2191 171st St
- 2131 170th St
- 17026 Bulger Ave
- 2030 170th St
- 16927 Crane Ave
- 16969 Orchard Ridge Ave
- 16879 Head Ave
- 16918 Shea Ave
- 17046 Winchester Ave
- 16876 Head Ave
- 1848 172nd St
- 17043 Annetta Ave
- 1913 170th St
- 16919 Western Ave
- 16840 Bulger Ave
- 16913 Western Ave
- 17308 Forestway Dr
- 16930 Winchester Ave
- 16963 Winchester Ave
- 16846 Orchard Ridge Ave