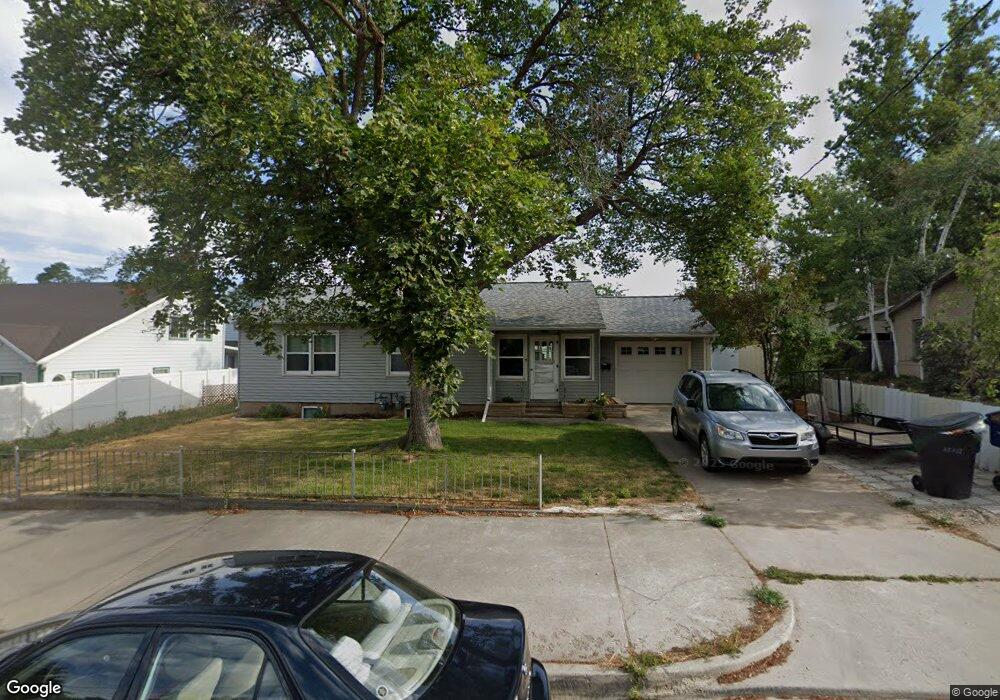
2185 Claybourne Ave S Salt Lake City, UT 84109
Canyon Rim NeighborhoodEstimated Value: $663,000 - $890,000
3
Beds
2
Baths
912
Sq Ft
$840/Sq Ft
Est. Value
About This Home
This home is located at 2185 Claybourne Ave S, Salt Lake City, UT 84109 and is currently estimated at $766,141, approximately $840 per square foot. 2185 Claybourne Ave S is a home located in Salt Lake County with nearby schools including Rosecrest Elementary School, Evergreen Junior High School, and Olympus High School.
Ownership History
Date
Name
Owned For
Owner Type
Purchase Details
Closed on
Nov 4, 2022
Sold by
Tamara Groves Family Trust
Bought by
Remlis Living Revocable Trust
Current Estimated Value
Purchase Details
Closed on
May 25, 2022
Sold by
Tamara Groves Family Trust
Bought by
Remlis Living Revocable Trust
Purchase Details
Closed on
Apr 21, 2022
Sold by
Kent A and Marca
Bought by
Remlis Living Trust
Purchase Details
Closed on
Dec 29, 2021
Sold by
Karen Groves Family Trust
Bought by
Merrell A Kent A and Merrell Marca
Purchase Details
Closed on
Mar 27, 2009
Sold by
Groves Tamara K
Bought by
Merrell A Kent and Tamara Groves Family Trust
Create a Home Valuation Report for This Property
The Home Valuation Report is an in-depth analysis detailing your home's value as well as a comparison with similar homes in the area
Home Values in the Area
Average Home Value in this Area
Purchase History
| Date | Buyer | Sale Price | Title Company |
|---|---|---|---|
| Nonchalant Properties Llc | -- | -- | |
| Lyons Colleen | -- | Onrecord Title | |
| Nonchalant Properties Llc | -- | -- | |
| Lyons Colleen | -- | Onrecord Title | |
| Remlis Living Revocable Trust | -- | -- | |
| Remlis Living Revocable Trust | -- | -- | |
| Remlis Living Revocable Trust | -- | None Listed On Document | |
| Remlis Living Revocable Trust | -- | None Listed On Document | |
| Remlis Living Trust | -- | None Listed On Document | |
| Remlis Living Trust | -- | None Listed On Document | |
| Merrell A Kent A | -- | None Listed On Document | |
| Merrell A Kent A | -- | None Listed On Document | |
| Merrell A Kent A | -- | None Listed On Document | |
| Merrell A Kent A | -- | None Listed On Document | |
| Merrell A Kent | -- | None Available | |
| Merrell A Kent | -- | None Available |
Source: Public Records
Mortgage History
| Date | Status | Borrower | Loan Amount |
|---|---|---|---|
| Open | Lyons Colleen | $647,500 |
Source: Public Records
Tax History Compared to Growth
Tax History
| Year | Tax Paid | Tax Assessment Tax Assessment Total Assessment is a certain percentage of the fair market value that is determined by local assessors to be the total taxable value of land and additions on the property. | Land | Improvement |
|---|---|---|---|---|
| 2025 | $4,221 | $702,400 | $442,000 | $260,400 |
| 2024 | $4,221 | $675,800 | $428,400 | $247,400 |
| 2023 | $3,628 | $560,700 | $424,100 | $136,600 |
| 2022 | $3,664 | $569,300 | $415,800 | $153,500 |
| 2021 | $3,157 | $425,300 | $388,100 | $37,200 |
| 2020 | $3,171 | $403,200 | $332,600 | $70,600 |
| 2019 | $356 | $337,200 | $271,700 | $65,500 |
| 2018 | $0 | $300,400 | $194,500 | $105,900 |
| 2017 | $275 | $271,400 | $194,500 | $76,900 |
| 2016 | $171 | $255,500 | $194,500 | $61,000 |
| 2015 | $2,458 | $291,100 | $225,500 | $65,600 |
| 2014 | -- | $280,000 | $221,200 | $58,800 |
Source: Public Records
Map
Nearby Homes
- 2290 E 2700 S
- 2267 E 2700 S
- 2221 E Fisher Ln
- 2036 E Highland View Cir
- 2056 Sierra View Cir
- 2066 Sierra Ridge Ct
- 3000 S Connor St Unit 11
- 2106 E Connor Park Cove
- 1930 E Atkin Ave
- 2692 Preston St
- 2835 S 2475 E
- 2626 S Preston St
- 2692 Wellington St E
- 3094 S 2300 E
- 2193 E Lambourne Ave Unit 3
- 1925 E Hillcrest Ave
- 2719 S Melbourne St
- 3123 S 2300 E
- 1830 E Parleys Canyon Blvd
- 1865 E Hillcrest Ave
- 2185 E Claybourne Ave
- 2199 Claybourne Ave S
- 2175 E Claybourne Ave
- 2197 E Claybourne Ave
- 2197 Claybourne Ave
- 2177 E Claybourne Ave
- 2207 Claybourne Ave
- 2193 Claybourne Ave S
- 2760 S Venar Cir
- 2760 Venar Cir
- 2220 Claybourne Ave
- 2200 Claybourne Ave
- 2198 Claybourne Ave
- 2752 Venar Cir
- 2219 Claybourne Ave
- 2188 Vimont Ave
- 2181 E Claybourne Ave
- 2181 Claybourne Ave
- 2181 Claybourne Ave Unit 10
- 2180 E Vimont Ave