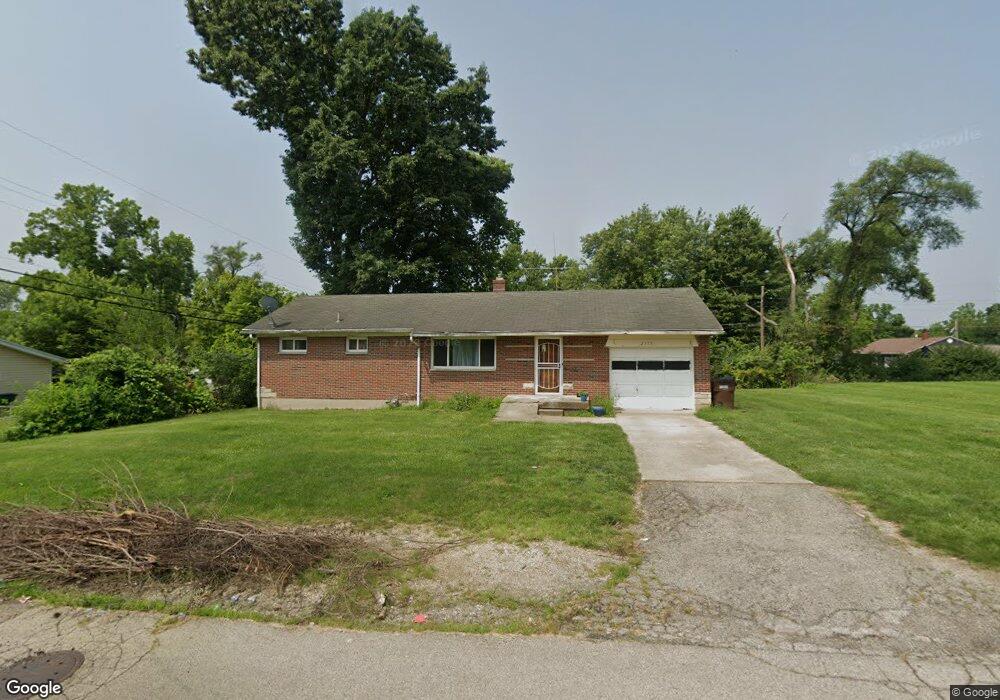
2185 Fairport Ave Dayton, OH 45406
Fort McKinley NeighborhoodEstimated Value: $82,000 - $107,000
3
Beds
1
Bath
1,008
Sq Ft
$93/Sq Ft
Est. Value
About This Home
This home is located at 2185 Fairport Ave, Dayton, OH 45406 and is currently estimated at $93,758, approximately $93 per square foot. 2185 Fairport Ave is a home located in Montgomery County with nearby schools including Valerie Elementary School, Imagine Klepinger Road Community School, and North Dayton School of Science & Discovery.
Ownership History
Date
Name
Owned For
Owner Type
Purchase Details
Closed on
Mar 5, 2024
Sold by
Baker Mary Elizabeth and Baker Johnnie L
Bought by
Baker Steffany Lashawn
Current Estimated Value
Purchase Details
Closed on
May 5, 2008
Sold by
Miles Michael J
Bought by
Us Bank Na
Purchase Details
Closed on
Apr 22, 2008
Sold by
Us Bank Na
Bought by
Baker Mary Elizabeth
Purchase Details
Closed on
Dec 30, 2004
Sold by
Jones Telisa
Bought by
Miles Ii Michael J and Miles Sarah
Home Financials for this Owner
Home Financials are based on the most recent Mortgage that was taken out on this home.
Original Mortgage
$25,000
Interest Rate
5.23%
Mortgage Type
Stand Alone Second
Purchase Details
Closed on
May 1, 2002
Sold by
Ellington Meredith J
Bought by
Jones Telisa
Home Financials for this Owner
Home Financials are based on the most recent Mortgage that was taken out on this home.
Original Mortgage
$55,250
Interest Rate
10.65%
Create a Home Valuation Report for This Property
The Home Valuation Report is an in-depth analysis detailing your home's value as well as a comparison with similar homes in the area
Home Values in the Area
Average Home Value in this Area
Purchase History
| Date | Buyer | Sale Price | Title Company |
|---|---|---|---|
| Baker Steffany Lashawn | $42,300 | None Listed On Document | |
| Us Bank Na | $30,000 | Sovereign Title Agency Llc | |
| Baker Mary Elizabeth | $22,000 | Sovereign Title Agency Llc | |
| Miles Ii Michael J | $68,000 | None Available | |
| Jones Telisa | $65,000 | -- |
Source: Public Records
Mortgage History
| Date | Status | Borrower | Loan Amount |
|---|---|---|---|
| Previous Owner | Miles Ii Michael J | $25,000 | |
| Previous Owner | Miles Ii Michael J | $43,000 | |
| Previous Owner | Jones Telisa | $55,250 |
Source: Public Records
Tax History Compared to Growth
Tax History
| Year | Tax Paid | Tax Assessment Tax Assessment Total Assessment is a certain percentage of the fair market value that is determined by local assessors to be the total taxable value of land and additions on the property. | Land | Improvement |
|---|---|---|---|---|
| 2024 | $1,086 | $14,800 | $4,320 | $10,480 |
| 2023 | $1,086 | $14,800 | $4,320 | $10,480 |
| 2022 | $1,136 | $11,390 | $3,330 | $8,060 |
| 2021 | $1,132 | $11,390 | $3,330 | $8,060 |
| 2020 | $1,130 | $11,390 | $3,330 | $8,060 |
| 2019 | $1,326 | $12,040 | $2,990 | $9,050 |
| 2018 | $1,328 | $12,040 | $2,990 | $9,050 |
| 2017 | $1,320 | $12,040 | $2,990 | $9,050 |
| 2016 | $1,532 | $13,500 | $3,330 | $10,170 |
| 2015 | $1,335 | $13,500 | $3,330 | $10,170 |
| 2014 | $1,335 | $13,500 | $3,330 | $10,170 |
| 2012 | -- | $14,360 | $5,040 | $9,320 |
Source: Public Records
Map
Nearby Homes
- 3748 Saint James Ave
- 2212 Chamberlin Ave
- 3593 Saint James Ave
- 2417 Wheeler Ave
- 2145 Kipling Dr
- 2127 Kensington Dr
- 3740 Kings Hwy
- 3738 Kings Hwy
- 2150 Kensington Dr
- 2200 Kensington Dr
- 1954 Kensington Dr
- 4445 Prescott Ave
- 1910 Kensington Dr
- 1906 Kensington Dr
- 2620 N Gettysburg Ave
- 1816 Wesleyan Rd
- 1579 Sundale Ave
- 2201 N Gettysburg Ave
- 4541 Waymire Ave
- 2726 Wentworth Ave
- 2193 Fairport Ave
- 2197 Fairport Ave
- 2188 Chamberlin Ave
- 2184 Chamberlin Ave
- 2192 Chamberlin Ave
- 2105 Fairport Ave
- 4007 Middlehurst Ln
- 3716 Saint James Ave
- 4011 Middlehurst Ln
- 2104 Chamberlin Ave
- 2104 Fairport Ave
- 2201 Fairport Ave
- 2200 Chamberlin Ave
- 3957 Middlehurst Ln
- 2204 Fairport Ave
- 2205 Fairport Ave
- 2189 Chamberlin Ave
- 2204 Chamberlin Ave
- 2185 Chamberlin Ave
- 2193 Chamberlin Ave