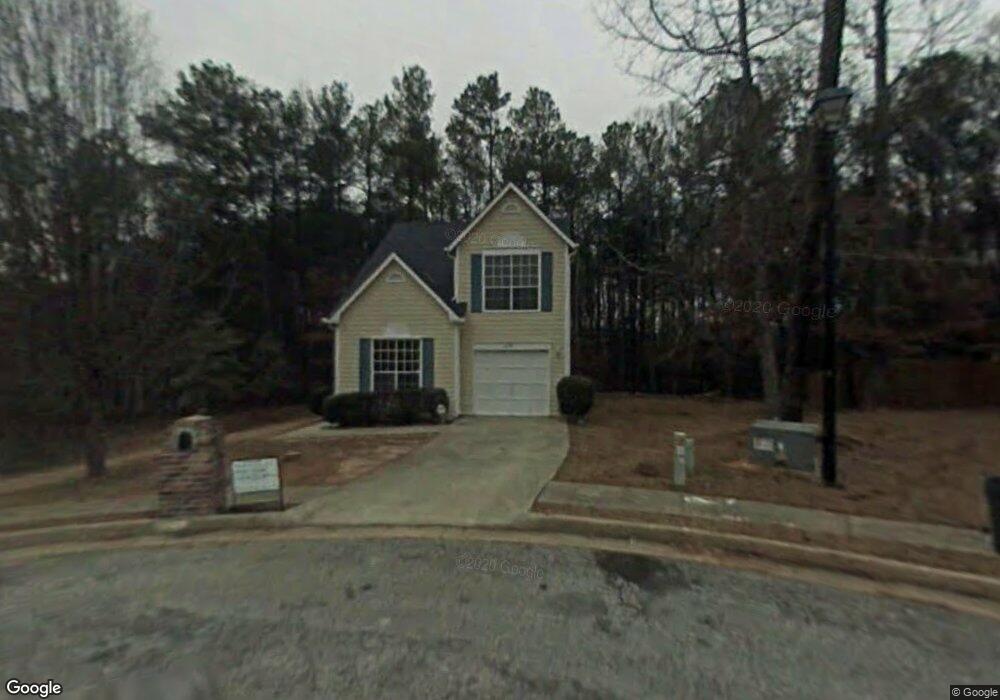
2185 Glenwood Downs Dr Decatur, GA 30035
Southwest DeKalb NeighborhoodEstimated Value: $253,000 - $290,000
4
Beds
3
Baths
1,648
Sq Ft
$160/Sq Ft
Est. Value
About This Home
This home is located at 2185 Glenwood Downs Dr, Decatur, GA 30035 and is currently estimated at $264,133, approximately $160 per square foot. 2185 Glenwood Downs Dr is a home located in DeKalb County with nearby schools including Snapfinger Elementary School, Columbia Middle School, and Columbia High School.
Ownership History
Date
Name
Owned For
Owner Type
Purchase Details
Closed on
Oct 5, 2007
Sold by
Morgan Stanley 2006-Wmc2
Bought by
Hicks Thomas
Current Estimated Value
Purchase Details
Closed on
Feb 6, 2007
Sold by
Mount Brandie
Bought by
Morgan Stanley Abs 2006-Wmc2
Purchase Details
Closed on
Mar 21, 2006
Sold by
Adefi Francis A and Adefi Adefunke I
Bought by
Mount Brandie
Home Financials for this Owner
Home Financials are based on the most recent Mortgage that was taken out on this home.
Original Mortgage
$24,720
Interest Rate
6.23%
Mortgage Type
Stand Alone Refi Refinance Of Original Loan
Purchase Details
Closed on
Aug 20, 1993
Sold by
Diversified Shelter Group
Bought by
Adefi Francis A
Home Financials for this Owner
Home Financials are based on the most recent Mortgage that was taken out on this home.
Original Mortgage
$79,000
Interest Rate
7.24%
Mortgage Type
FHA
Create a Home Valuation Report for This Property
The Home Valuation Report is an in-depth analysis detailing your home's value as well as a comparison with similar homes in the area
Home Values in the Area
Average Home Value in this Area
Purchase History
| Date | Buyer | Sale Price | Title Company |
|---|---|---|---|
| Hicks Thomas | $78,000 | -- | |
| Morgan Stanley Abs 2006-Wmc2 | $103,868 | -- | |
| Mount Brandie | $123,600 | -- | |
| Adefi Francis A | $78,500 | -- |
Source: Public Records
Mortgage History
| Date | Status | Borrower | Loan Amount |
|---|---|---|---|
| Previous Owner | Mount Brandie | $24,720 | |
| Previous Owner | Adefi Francis A | $79,000 |
Source: Public Records
Tax History Compared to Growth
Tax History
| Year | Tax Paid | Tax Assessment Tax Assessment Total Assessment is a certain percentage of the fair market value that is determined by local assessors to be the total taxable value of land and additions on the property. | Land | Improvement |
|---|---|---|---|---|
| 2025 | $2,757 | $104,360 | $14,000 | $90,360 |
| 2024 | $2,816 | $105,600 | $14,000 | $91,600 |
| 2023 | $2,816 | $94,320 | $14,000 | $80,320 |
| 2022 | $2,110 | $78,520 | $6,000 | $72,520 |
| 2021 | $1,730 | $62,040 | $6,000 | $56,040 |
| 2020 | $1,484 | $51,200 | $6,000 | $45,200 |
| 2019 | $1,452 | $50,160 | $6,000 | $44,160 |
| 2018 | $1,366 | $42,960 | $3,320 | $39,640 |
| 2017 | $1,636 | $28,760 | $3,320 | $25,440 |
| 2016 | $1,508 | $25,800 | $3,320 | $22,480 |
| 2014 | $1,084 | $15,800 | $3,320 | $12,480 |
Source: Public Records
Map
Nearby Homes
- 3985 Lindsey Dr
- 4083 Thetford Ct
- 4044 Lindsey Dr
- 3972 Glenwood Downs Ln
- 1905 Janet Ln
- 4094 E Glade Ct
- 2089 Glenwood Downs Dr
- 3932 Lindsey Dr
- 1942 Glenwood Downs Dr
- 2017 Lindsey Ln
- 1968 Copperfield Cir
- 4778 Glenwood Rd
- 1907 Oak Valley Rd
- 1901 Oak Valley Rd
- 1963 Oak Valley Rd
- 1969 Oak Valley Rd
- 4125 Lindsey Dr
- 2046 Copperfield Cir
- 2180 Glenwood Downs Dr
- 2179 Glenwood Downs Dr
- 3426 Glenwood Downs Dr
- 2176 Glenwood Downs Dr
- 2175 Glenwood Downs Dr
- 2170 Glenwood Downs Dr
- 2171 Glenwood Downs Dr
- 2164 Glenwood Downs Dr
- 4036 Lynns Way
- 2167 Glenwood Downs Dr
- 2158 Glenwood Downs Dr
- 2161 Glenwood Downs Dr
- 4009 Lindsey Dr
- 4015 Lindsey Dr
- 4003 Lindsey Dr
- 4021 Lindsey Dr
- 4030 Lynns Way
- 2157 Glenwood Downs Dr
- 0 Lynns Way
- 3997 Lindsey Dr Unit 1