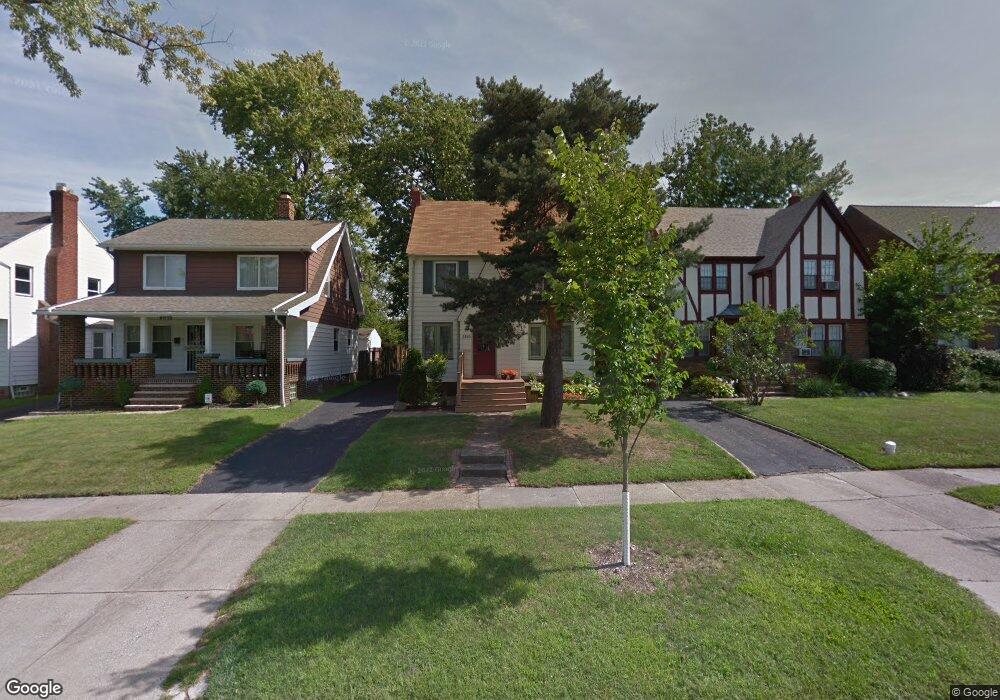
2185 Jackson Blvd Cleveland Heights, OH 44118
Estimated Value: $211,277 - $245,000
4
Beds
2
Baths
1,689
Sq Ft
$133/Sq Ft
Est. Value
About This Home
This home is located at 2185 Jackson Blvd, Cleveland Heights, OH 44118 and is currently estimated at $224,569, approximately $132 per square foot. 2185 Jackson Blvd is a home located in Cuyahoga County with nearby schools including Canterbury Elementary School, Roxboro Middle School, and Cleveland Heights High School.
Ownership History
Date
Name
Owned For
Owner Type
Purchase Details
Closed on
Mar 3, 1999
Sold by
George Lee
Bought by
Edwards Barry
Current Estimated Value
Home Financials for this Owner
Home Financials are based on the most recent Mortgage that was taken out on this home.
Original Mortgage
$57,000
Outstanding Balance
$13,831
Interest Rate
6.78%
Estimated Equity
$210,738
Purchase Details
Closed on
Sep 3, 1996
Sold by
Miller Gregory A
Bought by
Lee George
Home Financials for this Owner
Home Financials are based on the most recent Mortgage that was taken out on this home.
Original Mortgage
$79,200
Interest Rate
7.8%
Mortgage Type
Balloon
Purchase Details
Closed on
Sep 26, 1988
Sold by
Dollar Bank A Fed Savings
Bought by
Miller Gregory Asr
Purchase Details
Closed on
Jun 24, 1988
Sold by
Hamby Leroy
Bought by
Dollar Bank A Fed Savings
Purchase Details
Closed on
Nov 19, 1976
Sold by
Pollov Harold J and L G
Bought by
Hamby Leroy
Purchase Details
Closed on
Jan 1, 1975
Bought by
Pollov Harold J and L G
Create a Home Valuation Report for This Property
The Home Valuation Report is an in-depth analysis detailing your home's value as well as a comparison with similar homes in the area
Home Values in the Area
Average Home Value in this Area
Purchase History
| Date | Buyer | Sale Price | Title Company |
|---|---|---|---|
| Edwards Barry | $79,150 | Midland Title Security Inc | |
| Lee George | $67,000 | -- | |
| Miller Gregory Asr | $55,000 | -- | |
| Dollar Bank A Fed Savings | -- | -- | |
| Hamby Leroy | $36,900 | -- | |
| Pollov Harold J | -- | -- |
Source: Public Records
Mortgage History
| Date | Status | Borrower | Loan Amount |
|---|---|---|---|
| Open | Edwards Barry | $57,000 | |
| Previous Owner | Lee George | $79,200 |
Source: Public Records
Tax History Compared to Growth
Tax History
| Year | Tax Paid | Tax Assessment Tax Assessment Total Assessment is a certain percentage of the fair market value that is determined by local assessors to be the total taxable value of land and additions on the property. | Land | Improvement |
|---|---|---|---|---|
| 2024 | $5,766 | $65,520 | $13,440 | $52,080 |
| 2023 | $5,086 | $45,080 | $9,100 | $35,980 |
| 2022 | $5,061 | $45,080 | $9,100 | $35,980 |
| 2021 | $4,964 | $45,080 | $9,100 | $35,980 |
| 2020 | $4,901 | $40,250 | $8,120 | $32,130 |
| 2019 | $4,639 | $115,000 | $23,200 | $91,800 |
| 2018 | $4,534 | $40,250 | $8,120 | $32,130 |
| 2017 | $4,721 | $38,120 | $6,440 | $31,680 |
| 2016 | $4,661 | $38,120 | $6,440 | $31,680 |
| 2015 | $4,340 | $38,120 | $6,440 | $31,680 |
| 2014 | $4,340 | $37,380 | $6,300 | $31,080 |
Source: Public Records
Map
Nearby Homes
- 3593 Tullamore Rd
- 3485 Silsby Rd
- 3494 Raymont Blvd
- 3554 Raymont Blvd
- 3540 Silsby Rd
- 3525 Raymont Blvd
- 3621 Cedarbrook Rd
- 2272 S Taylor Rd
- 13605 Cedar Rd
- 3395 Tullamore Rd
- 2203 Brockway Rd
- 2087 Wynn Rd Unit 1
- 2235 Brockway Rd
- 2085 Wynn Rd Unit 2
- 3383 Tullamore Rd
- 2083 Wynn Rd Unit 3
- 2119 Rossmoor Rd
- 3366 Tullamore Rd
- 3368 Silsby Rd
- 2227 Cranston Rd
- 2187 Jackson Blvd
- 2183 Jackson Blvd
- 2179 Jackson Blvd
- 2191 Jackson Blvd
- 3519 Cedarbrook Rd
- 2177 Jackson Blvd
- 3521 Cedarbrook Rd
- 2199 Jackson Blvd
- 3525 Cedarbrook Rd
- 2171 Jackson Blvd
- 2186 Jackson Blvd
- 2190 Jackson Blvd
- 2184 Jackson Blvd
- 2192 Jackson Blvd
- 2180 Jackson Blvd
- 2203 Jackson Blvd
- 3527 Cedarbrook Rd
- 3522 Cedarbrook Rd
- 2178 Jackson Blvd
- 13514 Cedar Rd Unit 1