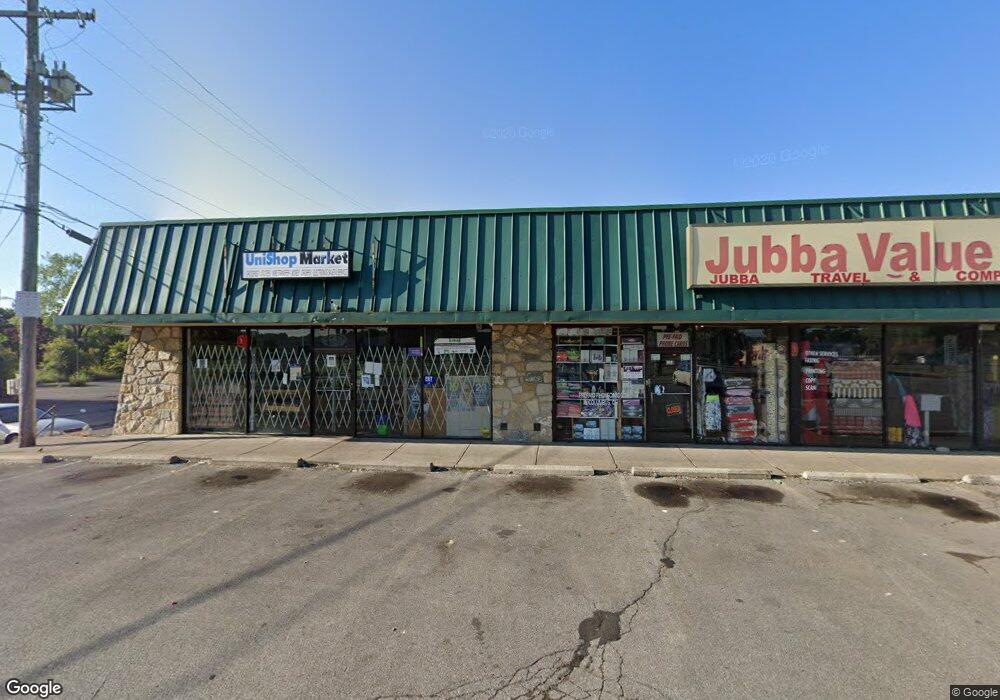
2185 Morse Rd Columbus, OH 43229
North Linden NeighborhoodEstimated Value: $1,334,383
--
Bed
--
Bath
10,710
Sq Ft
$125/Sq Ft
Est. Value
About This Home
This home is located at 2185 Morse Rd, Columbus, OH 43229 and is currently estimated at $1,334,383, approximately $124 per square foot. 2185 Morse Rd is a home located in Franklin County with nearby schools including North Linden Elementary School, Medina Middle School, and Mifflin High School.
Ownership History
Date
Name
Owned For
Owner Type
Purchase Details
Closed on
Nov 22, 2024
Sold by
Saucedo Group Llc
Bought by
Saucedo Investments Llc
Current Estimated Value
Purchase Details
Closed on
Jul 15, 2024
Sold by
2181-85 Morse Llc
Bought by
Saucedo Group Llc
Purchase Details
Closed on
Feb 6, 2003
Sold by
Block Jeff D and Block Toni L
Bought by
2181-85 Morse Llc
Purchase Details
Closed on
Dec 21, 2000
Sold by
National City Bank
Bought by
Block Jeff D
Home Financials for this Owner
Home Financials are based on the most recent Mortgage that was taken out on this home.
Original Mortgage
$350,000
Interest Rate
7.8%
Mortgage Type
Seller Take Back
Purchase Details
Closed on
Dec 19, 1990
Bought by
Bancohio National Bank Tr
Purchase Details
Closed on
Dec 1, 1984
Purchase Details
Closed on
May 1, 1983
Create a Home Valuation Report for This Property
The Home Valuation Report is an in-depth analysis detailing your home's value as well as a comparison with similar homes in the area
Home Values in the Area
Average Home Value in this Area
Purchase History
| Date | Buyer | Sale Price | Title Company |
|---|---|---|---|
| Saucedo Investments Llc | -- | None Listed On Document | |
| Saucedo Group Llc | -- | Talon Title | |
| 2181-85 Morse Llc | -- | Hummel Title Agency Inc | |
| Block Jeff D | $500,000 | Hummel Title Agency Inc | |
| Bancohio National Bank Tr | -- | -- | |
| -- | -- | -- | |
| -- | -- | -- |
Source: Public Records
Mortgage History
| Date | Status | Borrower | Loan Amount |
|---|---|---|---|
| Previous Owner | Block Jeff D | $350,000 |
Source: Public Records
Tax History Compared to Growth
Tax History
| Year | Tax Paid | Tax Assessment Tax Assessment Total Assessment is a certain percentage of the fair market value that is determined by local assessors to be the total taxable value of land and additions on the property. | Land | Improvement |
|---|---|---|---|---|
| 2024 | $17,044 | $219,330 | $82,540 | $136,790 |
| 2023 | $16,799 | $219,330 | $82,540 | $136,790 |
| 2022 | $15,711 | $198,470 | $61,680 | $136,790 |
| 2021 | $15,775 | $198,470 | $61,680 | $136,790 |
| 2020 | $15,672 | $198,470 | $61,680 | $136,790 |
| 2019 | $16,388 | $189,010 | $58,740 | $130,270 |
| 2018 | $8,168 | $189,010 | $58,740 | $130,270 |
| 2017 | $15,549 | $189,010 | $58,740 | $130,270 |
| 2016 | $16,697 | $182,010 | $58,740 | $123,270 |
| 2015 | $14,706 | $182,010 | $58,740 | $123,270 |
| 2014 | $14,700 | $182,010 | $58,740 | $123,270 |
| 2013 | $7,191 | $169,085 | $47,355 | $121,730 |
Source: Public Records
Map
Nearby Homes
- 2144 Colfax Ave
- 2077 Waymont Rd
- 4714 Ascot Dr
- 2244 Balmoral Rd
- 1890 Fenton St
- 4111 Walford St
- 2561 Adda Ave
- 2276 Taymouth Rd
- 2588 Adda Ave
- 2594 Adda Ave
- 2558 Clybourne Rd
- 2568 Clybourne Rd
- 2222 Trent Rd
- 2134 Trent Rd
- 2033 Brittany Rd
- 4885 Northtowne Blvd
- 1921 Dandridge Dr
- 4090 Cleveland Ave
- 4892 Brittany Ct W
- 0 Abington Rd Unit 224031739
- 2203 Morse Rd
- 2175 Morse Rd
- 4428 Walford St
- 2233 Morse Rd
- 2200 Walford Ln
- 2245 Morse Rd
- 4388 Walford St
- 2115 Morse Rd
- 2300 Fitzroy Place S
- 2130 Morse Rd
- 2271 Morse Rd
- 2295 Morse Rd
- 2163 Fitzroy Dr Unit 2081A
- 2163 Fitzroy Dr Unit 2081A
- 2163 Fitzroy Dr Unit 2081A
- 2163 Fitzroy Dr Unit 2081A
- 2163 Fitzroy Dr Unit 2081A
- 2161 Fitzroy Dr Unit 2081A
- 2161 Fitzroy Dr Unit 2081A
- 2161 Fitzroy Dr Unit 2081A