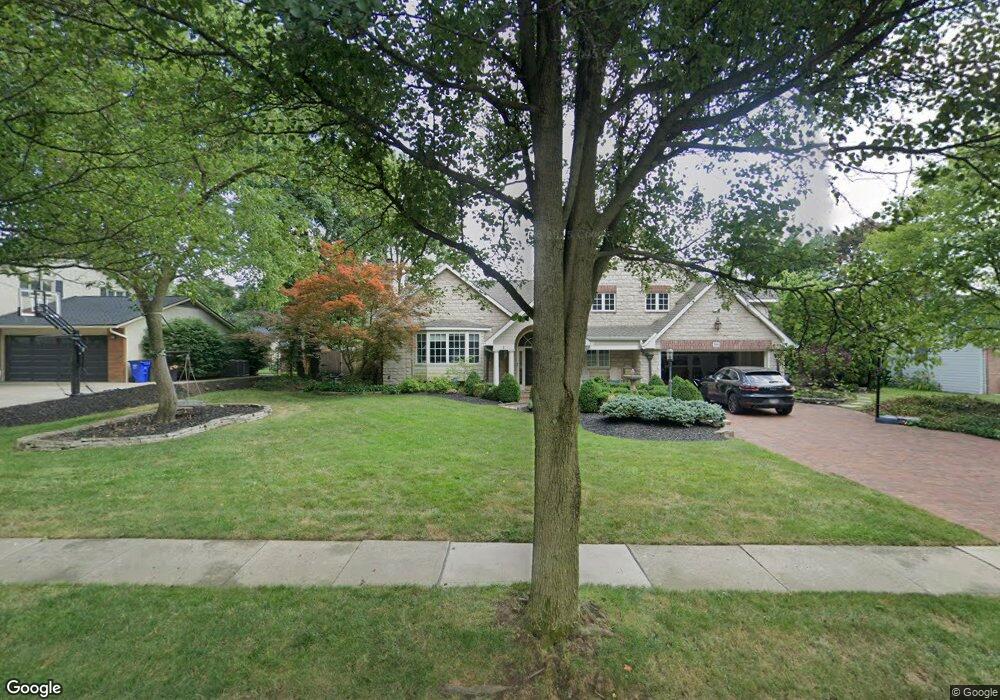
2185 Sheringham Rd Columbus, OH 43220
Estimated Value: $1,197,000 - $1,380,000
5
Beds
6
Baths
5,405
Sq Ft
$243/Sq Ft
Est. Value
About This Home
This home is located at 2185 Sheringham Rd, Columbus, OH 43220 and is currently estimated at $1,311,008, approximately $242 per square foot. 2185 Sheringham Rd is a home located in Franklin County with nearby schools including Windermere Elementary School, Hastings Middle School, and Upper Arlington High School.
Ownership History
Date
Name
Owned For
Owner Type
Purchase Details
Closed on
Jun 1, 2022
Sold by
Given Not
Bought by
Tozbikian Gary H and Tozbikian Stephanie K
Current Estimated Value
Purchase Details
Closed on
Jul 21, 2020
Sold by
Canei Regina R and Canei Robert A
Bought by
Tozbikian Stephanie K and Tozbikian Gary H
Home Financials for this Owner
Home Financials are based on the most recent Mortgage that was taken out on this home.
Interest Rate
2.98%
Purchase Details
Closed on
Feb 23, 2017
Sold by
Canei Robert A and Canei Regina R
Bought by
Canei Robert A and Canei Regina R
Purchase Details
Closed on
Jul 3, 1978
Bought by
Canei Robert A
Purchase Details
Closed on
Jun 1, 1978
Create a Home Valuation Report for This Property
The Home Valuation Report is an in-depth analysis detailing your home's value as well as a comparison with similar homes in the area
Home Values in the Area
Average Home Value in this Area
Purchase History
| Date | Buyer | Sale Price | Title Company |
|---|---|---|---|
| Tozbikian Gary H | -- | -- | |
| Tozbikian Stephanie K | $900,000 | -- | |
| Canei Robert A | -- | None Available | |
| Canei Robert A | -- | -- | |
| -- | $83,000 | -- |
Source: Public Records
Mortgage History
| Date | Status | Borrower | Loan Amount |
|---|---|---|---|
| Previous Owner | Tozbikian Stephanie K | -- |
Source: Public Records
Tax History Compared to Growth
Tax History
| Year | Tax Paid | Tax Assessment Tax Assessment Total Assessment is a certain percentage of the fair market value that is determined by local assessors to be the total taxable value of land and additions on the property. | Land | Improvement |
|---|---|---|---|---|
| 2024 | $19,324 | $330,510 | $83,200 | $247,310 |
| 2023 | $18,897 | $330,510 | $83,200 | $247,310 |
| 2022 | $21,860 | $312,830 | $56,700 | $256,130 |
| 2021 | $19,378 | $312,830 | $56,700 | $256,130 |
| 2020 | $12,952 | $220,010 | $56,700 | $163,310 |
| 2019 | $11,818 | $179,170 | $56,700 | $122,470 |
| 2018 | $11,384 | $179,170 | $56,700 | $122,470 |
| 2017 | $11,377 | $179,170 | $56,700 | $122,470 |
| 2016 | $11,027 | $175,530 | $47,810 | $127,720 |
| 2015 | $11,018 | $175,530 | $47,810 | $127,720 |
| 2014 | $11,030 | $175,530 | $47,810 | $127,720 |
| 2013 | $5,239 | $159,565 | $43,470 | $116,095 |
Source: Public Records
Map
Nearby Homes
- 4115 Woodbridge Rd
- 4450 Haverford Ct
- 2276 Johnston Rd
- 3918 Hillview Dr
- 4441 Kipling Rd
- 2276 Hoxton Ct
- 2300 Hoxton Ct
- 3920 Overdale Dr
- 2060 Fontenay Place
- 3804 Mountview Rd
- 2560 Chartwell Rd
- 4094 Lyon Dr
- 2681 Lane Rd
- 4781 Coach Rd
- 3701 Reed Rd
- 4720 Merrifield Place Unit 67
- 1610 Lafayette Dr Unit 1610
- 1501 Bridgeton Dr
- 1594 Lafayette Dr Unit 1594
- 2231 Atlee Ct Unit 12
- 2173 Sheringham Rd
- 2188 Mccoy Rd
- 2200 Mccoy Rd
- 2211 Sheringham Rd
- 2174 Mccoy Rd
- 2161 Sheringham Rd
- 2214 Mccoy Rd
- 2200 Sheringham Rd
- 4240 Woodhall Rd
- 2160 Mccoy Rd
- 2225 Sheringham Rd
- 2150 Sheringham Rd
- 2212 Sheringham Rd
- 2151 Sheringham Rd
- 4175 Ashmore Rd
- 2219 Mccoy Rd
- 4260 Woodhall Rd
- 4176 Ashmore Rd
- 4271 Woodhall Rd
- 2138 Sheringham Rd