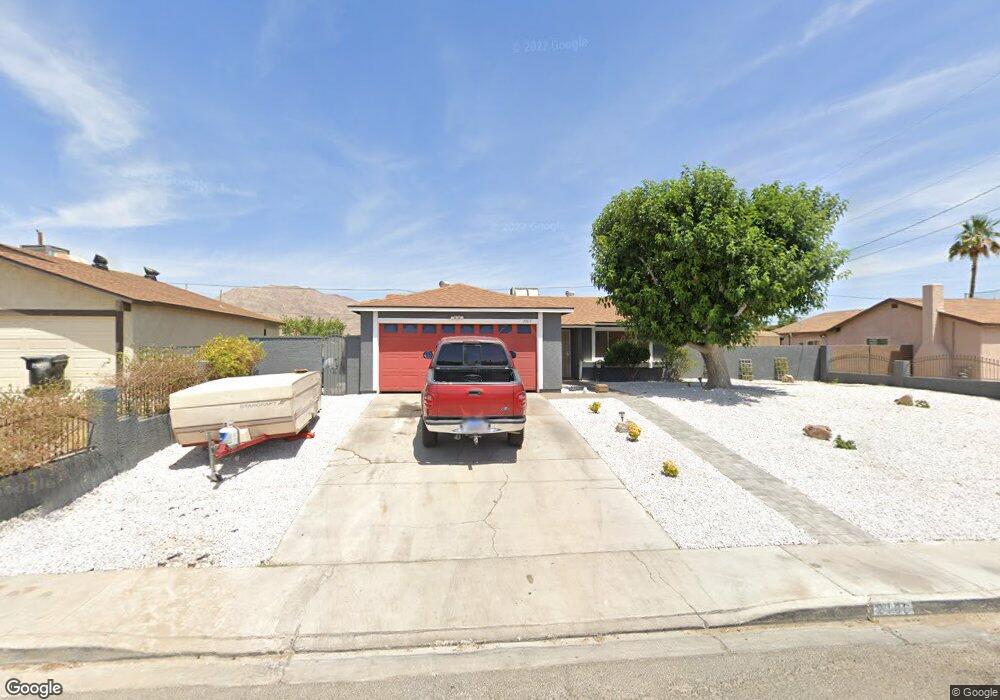
2186 Abarth St Las Vegas, NV 89142
Estimated Value: $368,000 - $418,000
4
Beds
2
Baths
1,383
Sq Ft
$288/Sq Ft
Est. Value
About This Home
This home is located at 2186 Abarth St, Las Vegas, NV 89142 and is currently estimated at $398,033, approximately $287 per square foot. 2186 Abarth St is a home located in Clark County with nearby schools including Cyril Wengert Elementary School, Duane D. Keller Middle School, and Las Vegas High School.
Ownership History
Date
Name
Owned For
Owner Type
Purchase Details
Closed on
Oct 21, 2016
Sold by
Curry Darryle
Bought by
Doyal Zella L
Current Estimated Value
Home Financials for this Owner
Home Financials are based on the most recent Mortgage that was taken out on this home.
Original Mortgage
$147,283
Outstanding Balance
$121,463
Interest Rate
4.4%
Mortgage Type
FHA
Estimated Equity
$276,570
Purchase Details
Closed on
Oct 20, 2016
Sold by
Elswood Darren
Bought by
Doyal Zella L
Home Financials for this Owner
Home Financials are based on the most recent Mortgage that was taken out on this home.
Original Mortgage
$147,283
Outstanding Balance
$121,463
Interest Rate
4.4%
Mortgage Type
FHA
Estimated Equity
$276,570
Purchase Details
Closed on
Jun 10, 2003
Sold by
Elswood Sandra L
Bought by
Elswood Darren
Create a Home Valuation Report for This Property
The Home Valuation Report is an in-depth analysis detailing your home's value as well as a comparison with similar homes in the area
Home Values in the Area
Average Home Value in this Area
Purchase History
| Date | Buyer | Sale Price | Title Company |
|---|---|---|---|
| Doyal Zella L | -- | Equity Title Of Nevada | |
| Doyal Zella L | $150,000 | Equity Title Of Nevada | |
| Elswood Darren | -- | -- |
Source: Public Records
Mortgage History
| Date | Status | Borrower | Loan Amount |
|---|---|---|---|
| Open | Doyal Zella L | $147,283 |
Source: Public Records
Tax History Compared to Growth
Tax History
| Year | Tax Paid | Tax Assessment Tax Assessment Total Assessment is a certain percentage of the fair market value that is determined by local assessors to be the total taxable value of land and additions on the property. | Land | Improvement |
|---|---|---|---|---|
| 2025 | $1,088 | $60,558 | $31,570 | $28,988 |
| 2024 | $1,057 | $60,558 | $31,570 | $28,988 |
| 2023 | $862 | $63,631 | $34,650 | $28,981 |
| 2022 | $1,332 | $58,151 | $30,800 | $27,351 |
| 2021 | $996 | $53,984 | $27,335 | $26,649 |
| 2020 | $964 | $54,453 | $27,335 | $27,118 |
| 2019 | $936 | $48,459 | $21,175 | $27,284 |
| 2018 | $909 | $49,960 | $23,100 | $26,860 |
| 2017 | $1,382 | $47,112 | $19,320 | $27,792 |
| 2016 | $862 | $43,931 | $15,120 | $28,811 |
| 2015 | $861 | $40,400 | $11,760 | $28,640 |
| 2014 | $834 | $37,318 | $8,400 | $28,918 |
Source: Public Records
Map
Nearby Homes
- 1950 Abarth St
- 1919 Niblick Cir
- 5539 Ballinger Dr
- 1841 Skywood Way
- 2454 Winterwood Blvd
- 2484 Anglia St
- 2508 Alfa Cir
- 2450 Tournament St
- 5406 Silverheart Ave
- 1745 Starridge Way
- 1721 Starridge Way
- 1728 S Christy Ln
- 2058 Citroen St
- 1718 S Christy Ln
- 5650 E Sahara Ave Unit 2007
- 5650 E Sahara Ave Unit 2010
- 2369 Citroen St
- 5634 Alcott Ave
- 5655 E Sahara Ave Unit 2048
- 5655 E Sahara Ave Unit 1003
- 2210 Abarth St
- 2162 Abarth St Unit 1041
- 2234 Abarth St
- 2138 Abarth St
- 5485 Cortina Ave
- 5492 Ferrari Ave
- 5475 Cortina Ave
- 2258 Abarth St
- 2114 Abarth St
- 5480 Cortina Ave
- 5495 Ferrari Ave
- 5465 Cortina Ave
- 2090 Abarth St
- 2282 Abarth St
- 5466 Ferrari Ave
- 5485 Ferrari Ave
- 5464 Cortina Ave
- 5475 Ferrari Ave
- 5455 Cortina Ave Unit 2
- 5479 Cleek St