2186 Dutch Broadway Unit BROADWAY Elmont, NY 11003
Estimated Value: $1,008,225 - $1,081,000
3
Beds
2
Baths
2,434
Sq Ft
$429/Sq Ft
Est. Value
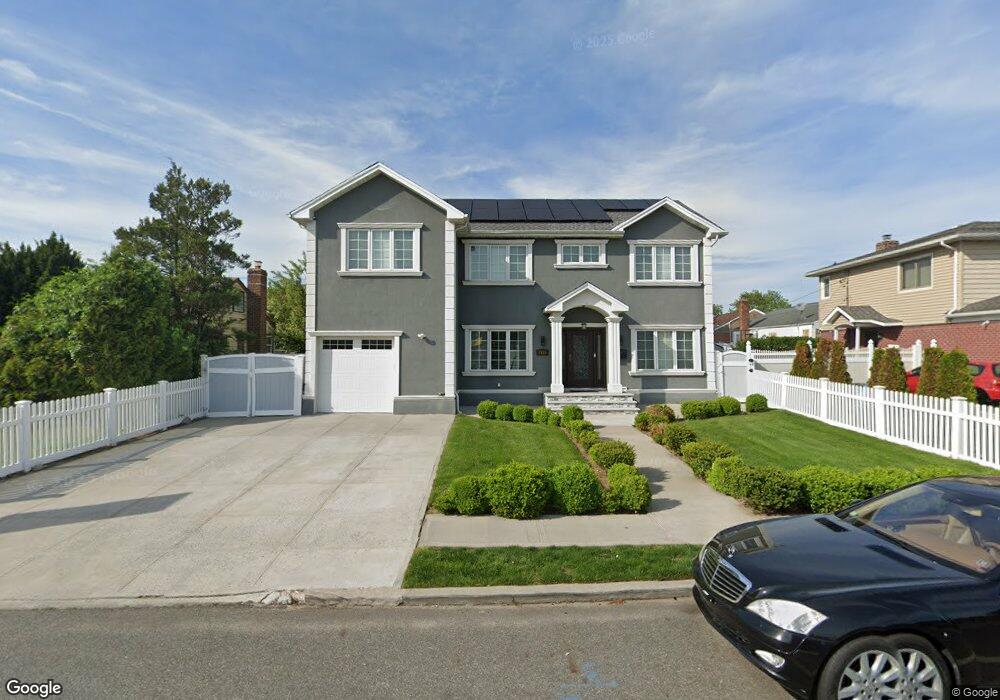
About This Home
This home is located at 2186 Dutch Broadway Unit BROADWAY, Elmont, NY 11003 and is currently estimated at $1,044,613, approximately $429 per square foot. 2186 Dutch Broadway Unit BROADWAY is a home located in Nassau County with nearby schools including Martin De Porres School, Word Christian Academy, and Bible Baptist Academy.
Ownership History
Date
Name
Owned For
Owner Type
Purchase Details
Closed on
May 26, 2020
Sold by
Prestige Real Estate Holdings Llc
Bought by
Babalola Adejoke A and Babalola Josiah O
Current Estimated Value
Home Financials for this Owner
Home Financials are based on the most recent Mortgage that was taken out on this home.
Original Mortgage
$679,500
Outstanding Balance
$602,325
Interest Rate
3.2%
Mortgage Type
New Conventional
Estimated Equity
$442,288
Purchase Details
Closed on
Sep 18, 2019
Sold by
Us Bank Trust Na
Bought by
Prestige Real Estate Holdings Llc
Purchase Details
Closed on
Jan 9, 2018
Sold by
Ettenger Jennifer
Bought by
Lsf10 Master Participation Trust
Purchase Details
Closed on
Jun 28, 2005
Sold by
Guilloteau Jean
Bought by
Charles Sabine
Create a Home Valuation Report for This Property
The Home Valuation Report is an in-depth analysis detailing your home's value as well as a comparison with similar homes in the area
Home Values in the Area
Average Home Value in this Area
Purchase History
| Date | Buyer | Sale Price | Title Company |
|---|---|---|---|
| Babalola Adejoke A | $850,000 | Fidelity National Title | |
| Prestige Real Estate Holdings Llc | $395,000 | None Available | |
| Lsf10 Master Participation Trust | $823,500 | -- | |
| Charles Sabine | $450,000 | -- |
Source: Public Records
Mortgage History
| Date | Status | Borrower | Loan Amount |
|---|---|---|---|
| Open | Babalola Adejoke A | $679,500 |
Source: Public Records
Tax History Compared to Growth
Tax History
| Year | Tax Paid | Tax Assessment Tax Assessment Total Assessment is a certain percentage of the fair market value that is determined by local assessors to be the total taxable value of land and additions on the property. | Land | Improvement |
|---|---|---|---|---|
| 2025 | $12,877 | $679 | $212 | $467 |
| 2024 | $3,867 | $659 | $212 | $447 |
| 2023 | $10,704 | $653 | $212 | $441 |
| 2022 | $10,704 | $421 | $262 | $159 |
| 2021 | $14,726 | $402 | $250 | $152 |
| 2020 | $18,933 | $696 | $531 | $165 |
| 2019 | $3,752 | $696 | $531 | $165 |
| 2018 | $3,572 | $696 | $0 | $0 |
| 2017 | $6,699 | $696 | $531 | $165 |
| 2016 | $10,113 | $696 | $531 | $165 |
| 2015 | $3,172 | $696 | $531 | $165 |
| 2014 | $3,172 | $696 | $531 | $165 |
| 2013 | $2,974 | $696 | $531 | $165 |
Source: Public Records
Map
Nearby Homes
- 11543 240th St
- 2093 Baylis Ave
- 11531 237th St
- 11538 238th St
- 11545 237th St
- 11504 237th St
- 11534 237th St
- 50 Crystal St
- 11619 240th St
- 2092 Hoffman Ave
- 174 Hoffman Ave
- 46 1st St
- 34 Diamond St
- 179 Hoffman Ave
- 1983 Dutch Broadway
- 11624 238th St
- 24 Garnet Place
- 115-88 233rd St
- 10 Cedar St
- 1 Tudor Crescent
- 2186 Dutch Broadway
- 2186 Dutch Broadway
- 21 Dutch Broadway Unit 86
- 21 Dutch Broadway
- 2192 Dutch Broadway
- 2176 Dutch Broadway
- 600 Ridge Rd
- 2115 Leighton Rd
- 2198 Dutch Broadway
- 2121 Leighton Rd
- 590 Ridge Rd
- 2127 Leighton Rd
- 2204 Dutch Broadway
- 2133 Leighton Rd
- 2210 Dutch Broadway
- 581 Conway Rd
- 2112 Leighton Rd
- 2139 Leighton Rd
- 2104 Leighton Rd
- 2216 Dutch Broadway