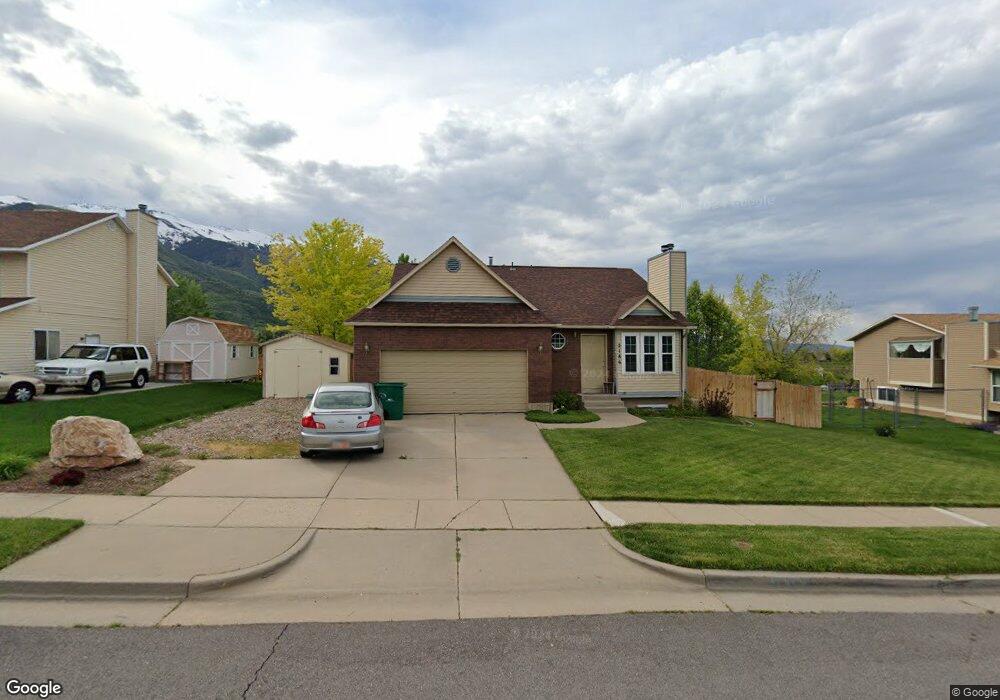
2186 E 3250 N Layton, UT 84040
Estimated Value: $488,000 - $529,000
5
Beds
2
Baths
2,416
Sq Ft
$211/Sq Ft
Est. Value
About This Home
This home is located at 2186 E 3250 N, Layton, UT 84040 and is currently estimated at $510,645, approximately $211 per square foot. 2186 E 3250 N is a home located in Davis County with nearby schools including Mountain View Elementary School, North Layton Junior High School, and Northridge High School.
Ownership History
Date
Name
Owned For
Owner Type
Purchase Details
Closed on
Mar 15, 2018
Sold by
Bybee Denise
Bought by
Bybee Denise Ann
Current Estimated Value
Home Financials for this Owner
Home Financials are based on the most recent Mortgage that was taken out on this home.
Original Mortgage
$193,000
Outstanding Balance
$164,663
Interest Rate
4.38%
Mortgage Type
New Conventional
Estimated Equity
$345,982
Purchase Details
Closed on
Feb 27, 2014
Sold by
Marra Jackie and Marra David
Bought by
Bybee Denise
Home Financials for this Owner
Home Financials are based on the most recent Mortgage that was taken out on this home.
Original Mortgage
$199,405
Interest Rate
4.38%
Mortgage Type
New Conventional
Purchase Details
Closed on
May 13, 2013
Sold by
Marra Jackie
Bought by
Marra Jackie and Marra David
Home Financials for this Owner
Home Financials are based on the most recent Mortgage that was taken out on this home.
Original Mortgage
$118,000
Interest Rate
2.7%
Mortgage Type
New Conventional
Create a Home Valuation Report for This Property
The Home Valuation Report is an in-depth analysis detailing your home's value as well as a comparison with similar homes in the area
Home Values in the Area
Average Home Value in this Area
Purchase History
| Date | Buyer | Sale Price | Title Company |
|---|---|---|---|
| Bybee Denise Ann | -- | Backman Title | |
| Bybee Denise | -- | Highland Title Agency | |
| Marra Jackie | -- | Metro National Title | |
| Marra Jacie | -- | Metro National Title |
Source: Public Records
Mortgage History
| Date | Status | Borrower | Loan Amount |
|---|---|---|---|
| Open | Bybee Denise Ann | $193,000 | |
| Previous Owner | Bybee Denise | $199,405 | |
| Previous Owner | Marra Jacie | $118,000 |
Source: Public Records
Tax History Compared to Growth
Tax History
| Year | Tax Paid | Tax Assessment Tax Assessment Total Assessment is a certain percentage of the fair market value that is determined by local assessors to be the total taxable value of land and additions on the property. | Land | Improvement |
|---|---|---|---|---|
| 2025 | $2,650 | $251,900 | $123,792 | $128,108 |
| 2024 | $2,513 | $242,550 | $147,746 | $94,804 |
| 2023 | $2,468 | $425,000 | $145,510 | $279,490 |
| 2022 | $2,578 | $243,100 | $77,146 | $165,954 |
| 2021 | $2,359 | $331,000 | $125,925 | $205,075 |
| 2020 | $2,159 | $290,000 | $99,883 | $190,117 |
| 2019 | $2,120 | $281,000 | $102,909 | $178,091 |
| 2018 | $1,926 | $256,000 | $101,447 | $154,553 |
| 2016 | $1,704 | $119,020 | $47,118 | $71,902 |
| 2015 | $1,673 | $111,760 | $47,118 | $64,642 |
| 2014 | $1,736 | $119,731 | $40,972 | $78,759 |
| 2013 | -- | $104,734 | $31,020 | $73,714 |
Source: Public Records
Map
Nearby Homes